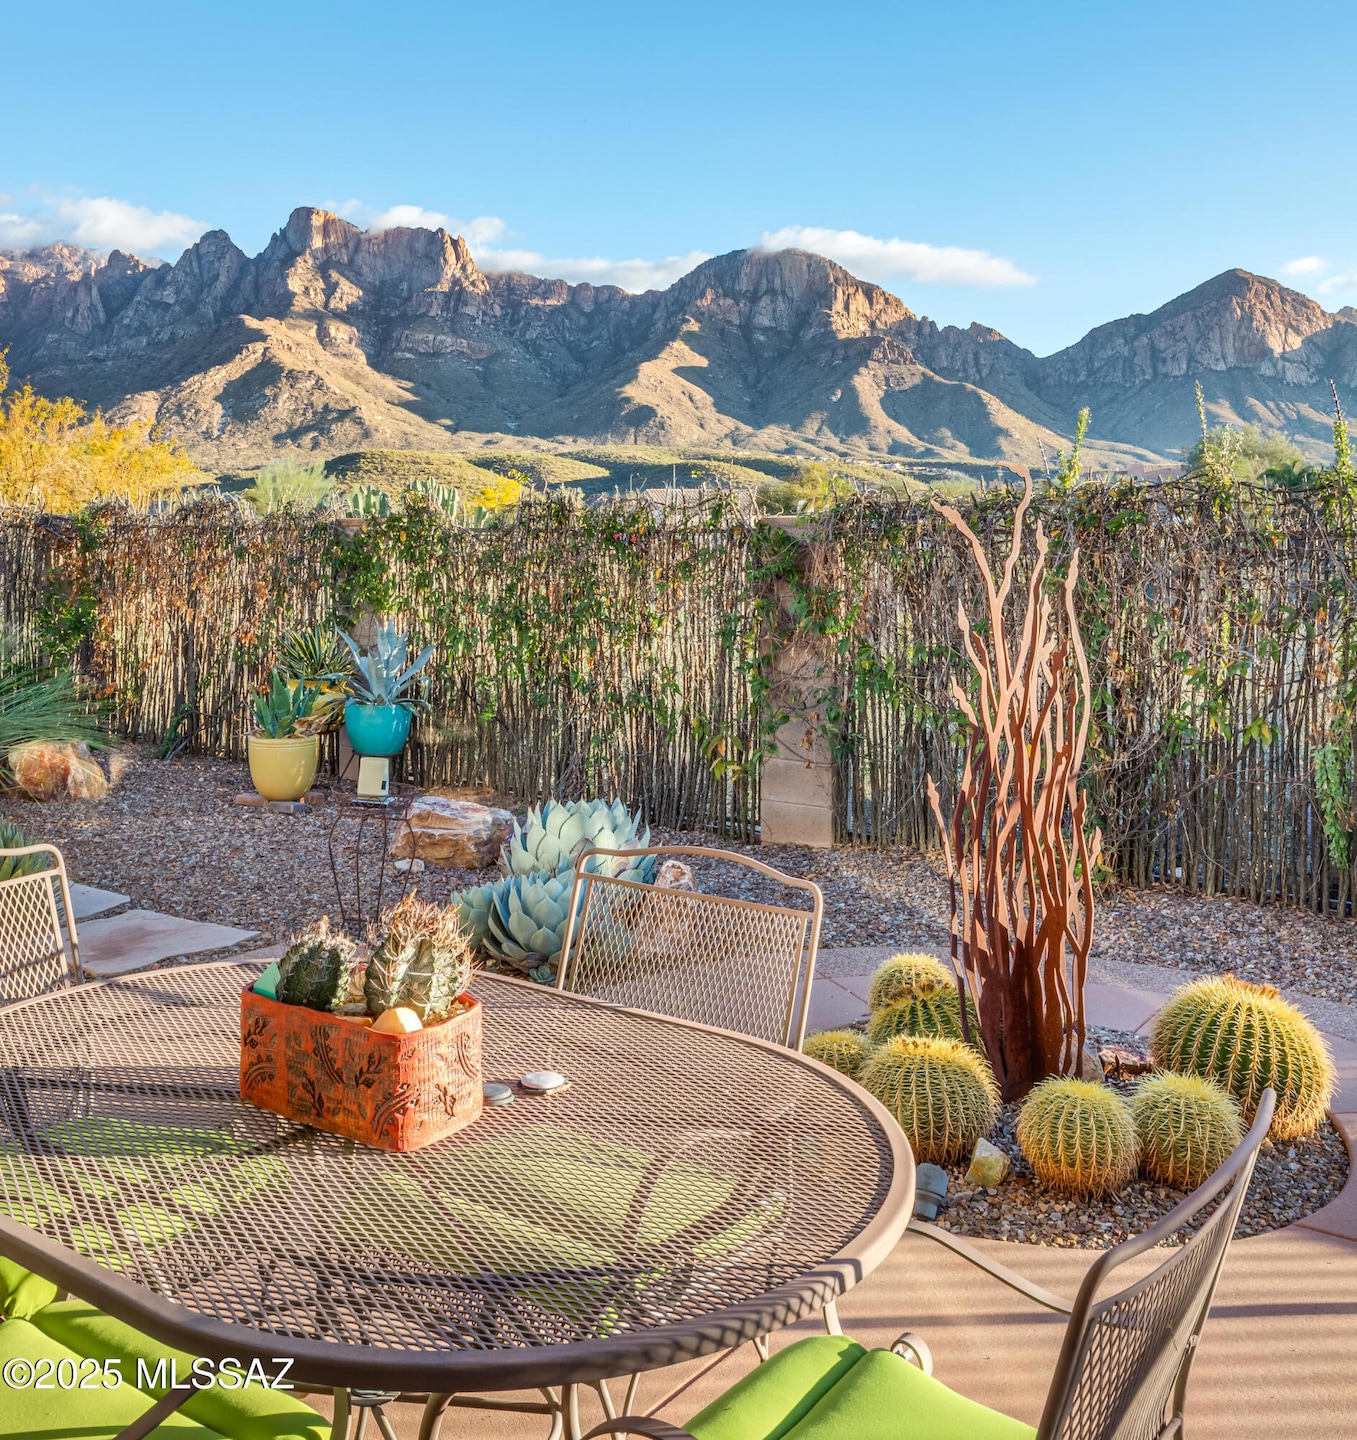
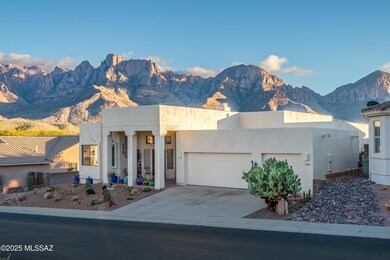
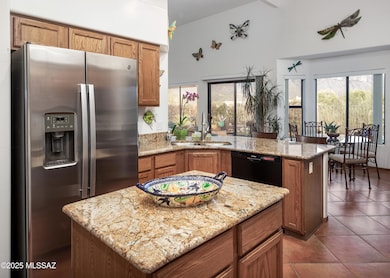
NOT LISTED FOR SALE

1744 E Ganymede Dr Tucson, AZ 85737

Estimated Value: $518,177 - $634,000

-- Bed
2 Baths
2,319 Sq Ft
$251/Sq Ft Est. Value

About This Home

This home is located at 1744 E Ganymede Dr, Tucson, AZ 85737 and is currently estimated at $581,044, approximately $250 per square foot. 1744 E Ganymede Dr is a home located in Pima County with nearby schools including Painted Sky Elementary School, Ironwood Ridge High School, and BASIS Oro Valley Primary School.

Ownership History

Date Name Owned For Owner Type

Purchase Details

Closed on
Nov 1, 2002
Sold by
Honn Richard J and Honn Jean Oconnell
Bought by
Honn Steven J and Honn Sheryl L
Current Estimated Value
$581,044

Purchase Details

Closed on
Jul 17, 2001
Sold by
Mcdonell Charles E and Mcdonell Angeline
Bought by
Honn Richard J and Oconnell Honn Jean

Home Financials for this Owner

Home Financials are based on the most recent Mortgage that was taken out on this home.
Original Mortgage
$140,000
Interest Rate
7.21%
Mortgage Type
New Conventional

Purchase Details

Closed on
Jul 18, 1994
Sold by
Maxim Development Ltd
Bought by
Mcdonell Charles E and Mcdonell Angeline

Purchase Details

Closed on
Nov 1, 1993
Sold by
Chicago Trust Company Of Az Tr 1205
Bought by
Maxim Development Ltd

Home Financials for this Owner

Home Financials are based on the most recent Mortgage that was taken out on this home.
Original Mortgage
$31,757
Interest Rate
6.95%
Source: Public Records

Range of Values:

Collateral Analytics

Collateral Analytics Collateral Analytics AVMs (Automated Valuation Model) employ a number of statistical approaches combined with neighborhood-specific comparable selection guarantees the most up-to-date and precise valuations.

Not Available

Collateral Analytics does not have data for the current month. Please view the chart for historical values.

ICE

ICE Mortgage Technology ICE Mortgage Technology’s AVM (Automated Valuation Model) is a state-of-the-art online residential property valuation tool that provides a quick and accurate estimate of the value of almost any home in the U.S.

Not Available

ICE Mortgage Technology does not have data for the current month. Please view the chart for historical values.

First American

First American First American Data & Analytics’ next-generation AVM combines unrivaled data assets with a blended ensemble of valuation models to produce highly accurate, reliable valuations you can trust.

Not Available

First American does not have data for the current month. Please view the chart for historical values.

Quantarium

Quantarium Quantarium’s valuation service, repeatedly proven the industry’s most accurate and comprehensive, is supercharged with a self-learning and auto-tuning AI engine that continually becomes smarter and more accurate as it processes daily inputs from the industry’s leading RE data lake.

Not Available

Quantarium does not have data for the current month. Please view the chart for historical values.

Average Value
Not Available
List Price
Sold Price
Create a Home Valuation Report for This Property
The Home Valuation Report is an in-depth analysis detailing your home's value as well as a comparison with similar homes in the area

Home Values in the Area

Source: Public Records

Average Home Value in this Area


Source: Public Records

Purchase History

Date Buyer Sale Price Title Company
Honn Steven J -- --
Honn Richard J $240,000 --
Mcdonell Charles E $172,016 --
Maxim Development Ltd $41,624 Chicago Title
Source: Public Records

Mortgage History

Date Status Borrower Loan Amount
Open Honn Richard J $110,000
Closed Honn Richard J $140,000
Previous Owner Maxim Development Ltd $31,757
Source: Public Records

Tax History Compared to Growth

Source: Public Records

Tax History

Year Tax Paid Tax Assessment Tax Assessment Total Assessment is a certain percentage of the fair market value that is determined by local assessors to be the total taxable value of land and additions on the property. Land Improvement
2024 $3,865 $32,193 -- --
2023 $3,865 $30,660 $0 $0
2022 $3,679 $29,200 $0 $0
2021 $3,713 $27,058 $0 $0
2020 $3,653 $27,058 $0 $0
2019 $3,537 $26,697 $0 $0
2018 $3,385 $23,373 $0 $0
2017 $3,320 $23,373 $0 $0
2016 $3,103 $22,610 $0 $0
2015 $3,017 $21,533 $0 $0
Source: Public Records

Map