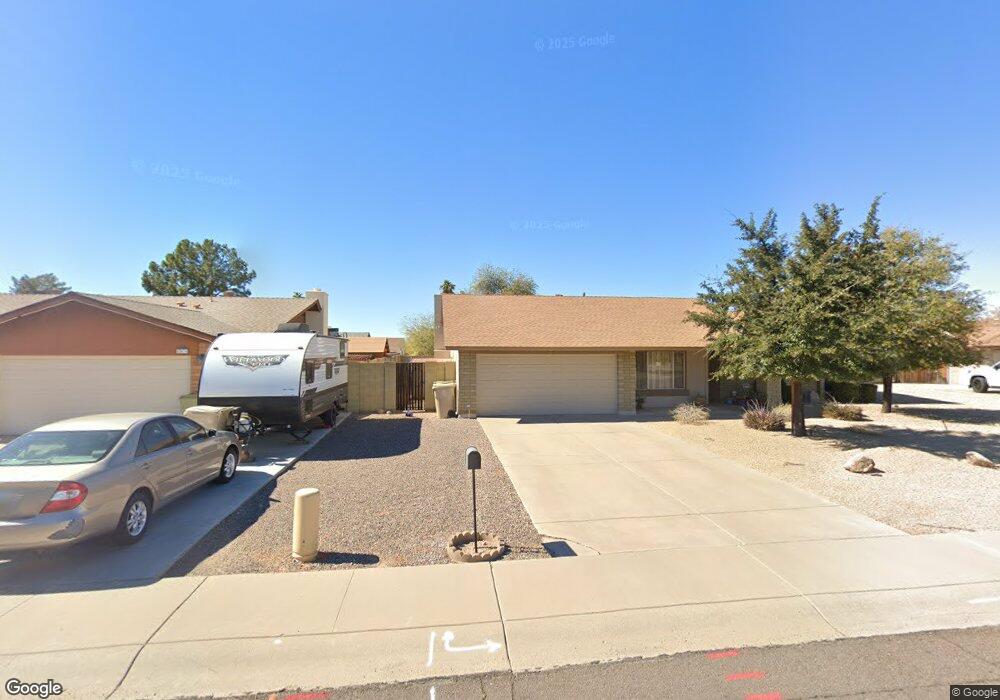
17440 N 60th Ave Glendale, AZ 85308
Arrowhead NeighborhoodEstimated Value: $424,028 - $489,000
Studio
2
Baths
1,487
Sq Ft
$312/Sq Ft
Est. Value
About This Home
This home is located at 17440 N 60th Ave, Glendale, AZ 85308 and is currently estimated at $464,007, approximately $312 per square foot. 17440 N 60th Ave is a home located in Maricopa County with nearby schools including Greenbrier Elementary School, Highland Lakes School, and Deer Valley High School.
Ownership History
Date
Name
Owned For
Owner Type
Purchase Details
Closed on
Mar 14, 2008
Sold by
Tolbert Wayne and Tolbert Mary K
Bought by
Tolbert James
Current Estimated Value
Purchase Details
Closed on
Aug 1, 2007
Sold by
Hicks Denise
Bought by
Hicks Renardo
Purchase Details
Closed on
Dec 2, 2004
Sold by
Durbin Erin E
Bought by
Durbin Andrew
Purchase Details
Closed on
Jul 7, 1994
Sold by
Kleppinger Brian
Bought by
Durbin Andrew and Durbin Erin E
Home Financials for this Owner
Home Financials are based on the most recent Mortgage that was taken out on this home.
Original Mortgage
$10,063
Interest Rate
8.53%
Purchase Details
Closed on
May 11, 1994
Sold by
Durbin Patricia Jean
Bought by
Durbin Andrew
Home Financials for this Owner
Home Financials are based on the most recent Mortgage that was taken out on this home.
Original Mortgage
$10,063
Interest Rate
8.53%
Create a Home Valuation Report for This Property
The Home Valuation Report is an in-depth analysis detailing your home's value as well as a comparison with similar homes in the area
Home Values in the Area
Average Home Value in this Area
Purchase History
| Date | Buyer | Sale Price | Title Company |
|---|---|---|---|
| Tolbert James | -- | None Available | |
| Hicks Renardo | -- | Stewart Title & Trust Of Pho | |
| Elliott Construction Inc | -- | Stewart Title & Trust Of Pho | |
| Durbin Andrew | -- | -- | |
| Durbin Andrew | -- | First Service Title Agency I | |
| Kleppinger Brian | -- | First Service Title Agency I | |
| Durbin Andrew | -- | First Service Title Agency I |
Source: Public Records
Mortgage History
| Date | Status | Borrower | Loan Amount |
|---|---|---|---|
| Previous Owner | Durbin Andrew | $10,063 |
Source: Public Records
Tax History
| Year | Tax Paid | Tax Assessment Tax Assessment Total Assessment is a certain percentage of the fair market value that is determined by local assessors to be the total taxable value of land and additions on the property. | Land | Improvement |
|---|---|---|---|---|
| 2025 | $1,340 | $16,607 | -- | -- |
| 2024 | $1,324 | $15,816 | -- | -- |
| 2023 | $1,324 | $30,730 | $6,140 | $24,590 |
| 2022 | $1,290 | $23,750 | $4,750 | $19,000 |
| 2021 | $1,360 | $21,580 | $4,310 | $17,270 |
| 2020 | $1,345 | $20,920 | $4,180 | $16,740 |
| 2019 | $1,311 | $19,200 | $3,840 | $15,360 |
| 2018 | $1,279 | $19,370 | $3,870 | $15,500 |
| 2017 | $1,244 | $18,710 | $3,740 | $14,970 |
| 2016 | $1,180 | $14,360 | $2,870 | $11,490 |
| 2015 | $1,094 | $14,060 | $2,810 | $11,250 |
Source: Public Records
Map
Nearby Homes
- 17608 N 62nd Dr
- 17412 N 58th Ln
- 17620 N 58th Ln
- 6017 W Villa Maria Dr
- 6389 W Muriel Dr
- 17838 N 57th Ave
- 17412 N 56th Ave
- 17424 N 56th Ave
- 17458 N 64th Dr
- 18161 N 63rd Ln
- 6607 W Camino De La Campana
- 5523 W Angela Dr
- 17261 N 66th Dr
- 6016 W Kings Ave
- 17613 N 55th Dr
- 18408 N 56th Ln
- 17414 N 66th Ln
- 5626 W Bluefield Ave
- 17220 N 55th Ave
- 17202 N 66th Dr
- 17432 N 60th Dr
- 17448 N 60th Dr
- 17432 N 60th Ave
- 6040 W Campo Bello Dr
- 17456 N 60th Dr
- 17443 N 61st Ave
- 17439 N 60th Dr
- 17431 N 60th Dr
- 17447 N 60th Dr
- 6048 W Campo Bello Dr
- 17464 N 60th Ave
- 6033 W Campo Bello Dr
- 6025 W Campo Bello Dr
- 17455 N 60th Dr
- 6017 W Campo Bello Dr
- 6041 W Campo Bello Dr
- 17601 N 61st Ave
- 17442 N 60th Ave
- 17434 N 60th Ave
- 6049 W Campo Bello Dr
Your Personal Tour Guide
Ask me questions while you tour the home.