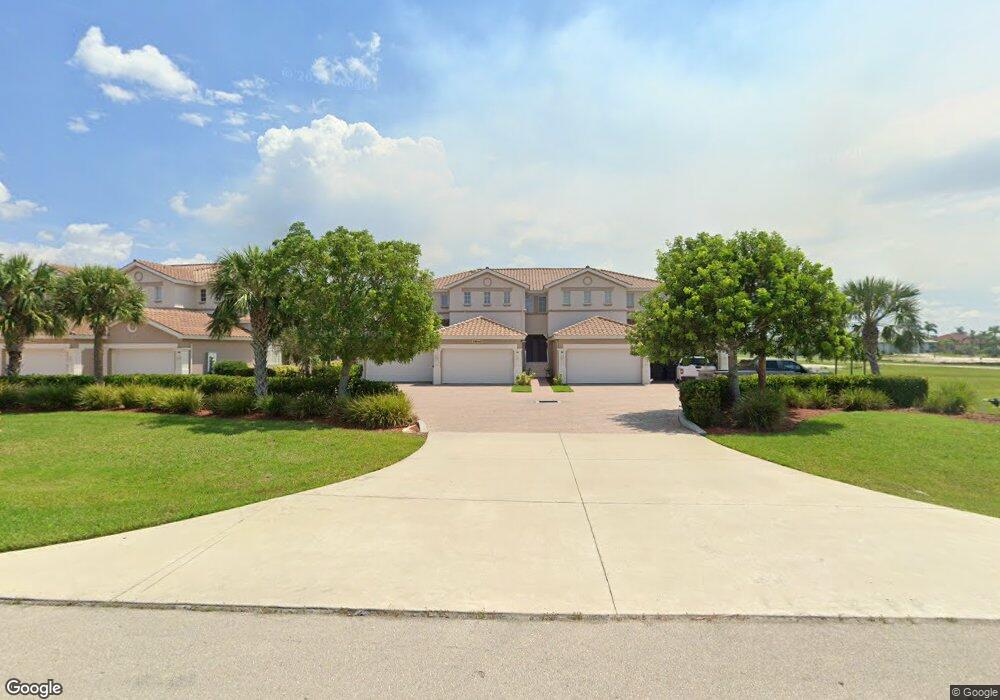
17444 Boca Vista Rd Unit 444B Punta Gorda, FL 33955
Burnt Store NeighborhoodEstimated Value: $281,000 - $395,000
3
Beds
2
Baths
1,844
Sq Ft
$179/Sq Ft
Est. Value
About This Home
This home is located at 17444 Boca Vista Rd Unit 444B, Punta Gorda, FL 33955 and is currently estimated at $330,105, approximately $179 per square foot. 17444 Boca Vista Rd Unit 444B is a home located in Charlotte County with nearby schools including East Elementary School, Punta Gorda Middle School, and Charlotte High School.
Ownership History
Date
Name
Owned For
Owner Type
Purchase Details
Closed on
Mar 12, 2021
Sold by
Fleming Carla
Bought by
Villemonte Hedi J and Villemonte Michael
Current Estimated Value
Purchase Details
Closed on
Nov 30, 2020
Sold by
Fleming John T and Fleming Carla M
Bought by
Fleming Carla M
Purchase Details
Closed on
Dec 30, 2019
Sold by
Parker Guy D and Parker Darlene E
Bought by
Fleming John T and Fleming Carla M
Purchase Details
Closed on
Aug 13, 2019
Sold by
Parker Guy D and Parker Darlene
Bought by
Parker Guy D and Parker Darlene
Purchase Details
Closed on
Jul 30, 2018
Sold by
Ludwig Kenneth W and Ludwig Carla J
Bought by
Parker Guy D and Parker Darlene
Purchase Details
Closed on
Jun 26, 2015
Sold by
Ray Terry M and Ray Lenora S
Bought by
Ludwig Kenneth W and Ludwig Carla J
Purchase Details
Closed on
Nov 1, 2012
Sold by
Reynolds Donald E and Reynolds Donald B
Bought by
Ray Terry M and Ray Lenora S
Create a Home Valuation Report for This Property
The Home Valuation Report is an in-depth analysis detailing your home's value as well as a comparison with similar homes in the area
Home Values in the Area
Average Home Value in this Area
Purchase History
| Date | Buyer | Sale Price | Title Company |
|---|---|---|---|
| Villemonte Hedi J | $232,000 | Hometown Ttl & Closing Svcs | |
| Fleming Carla M | -- | None Available | |
| Fleming John T | $223,900 | All Coast Title & Escrow | |
| Parker Guy D | -- | Accommodation | |
| Parker Guy D | $220,000 | All American Title Svcs Llc | |
| Ludwig Kenneth W | $185,000 | First Intl Title Inc | |
| Ray Terry M | $129,900 | Csb Title Services |
Source: Public Records
Tax History Compared to Growth
Tax History
| Year | Tax Paid | Tax Assessment Tax Assessment Total Assessment is a certain percentage of the fair market value that is determined by local assessors to be the total taxable value of land and additions on the property. | Land | Improvement |
|---|---|---|---|---|
| 2023 | $4,838 | $212,792 | $0 | $0 |
| 2022 | $3,874 | $193,447 | $0 | $193,447 |
| 2021 | $3,794 | $181,672 | $0 | $181,672 |
| 2020 | $3,643 | $173,261 | $0 | $173,261 |
| 2019 | $2,293 | $152,958 | $0 | $0 |
| 2018 | $3,566 | $181,672 | $0 | $181,672 |
| 2017 | $2,513 | $159,725 | $0 | $0 |
| 2016 | $2,252 | $156,440 | $0 | $0 |
| 2015 | $1,531 | $108,214 | $0 | $0 |
| 2014 | $1,504 | $107,355 | $0 | $0 |
Source: Public Records
Map
Nearby Homes
- 17434 Boca Vista Rd Unit 1006
- 17447 Belie Way
- 17457 Belie Way
- 17455 Boca Vista Rd
- 17460 Boca Vista Rd
- 17459 Boca Vista Rd
- 17440 Belie Way
- 17448 Belie Way
- 17462 Belie Way
- 17475 Belie Way
- 17495 Boca Vista Rd Unit 6
- 23999 Cedar Rapids Rd
- 17457 Fuego Ln
- 17425 Fuego Ln
- 17465 Fuego Ln
- 17481 Fuego Ln
- 17424 Fuego Ln
- 17318 Acapulco Rd
- 17458 Fuego Ln
- 17466 Fuego Ln
- 17444 Boca Vista Rd Unit 1002
- 17444 Boca Vista Rd Unit 434A
- 17444 Boca Vista Rd Unit 1001
- 17444 Boca Vista Rd Unit 1003
- 17444 Boca Vista Rd Unit 444D
- 17444 Boca Vista Rd Unit 444C
- 17444 Boca Vista Rd Unit 444A
- 17434 Boca Vista Rd Unit 434D
- 17434 Boca Vista Rd Unit 434C
- 17434 Boca Vista Rd Unit 434B
- 17434 Boca Vista Rd Unit 434A
- 17434 Boca Vista Rd Unit 1005
- 17434 Road
- 17444 Road
- 17454 Boca Vista Rd
- 17461 Belie Way
- 17447 Boca Vista Rd
- 17505 Boca Vista Rd Unit 5
- 17505 Boca Vista Rd Unit 2
- 17456 Belie Way