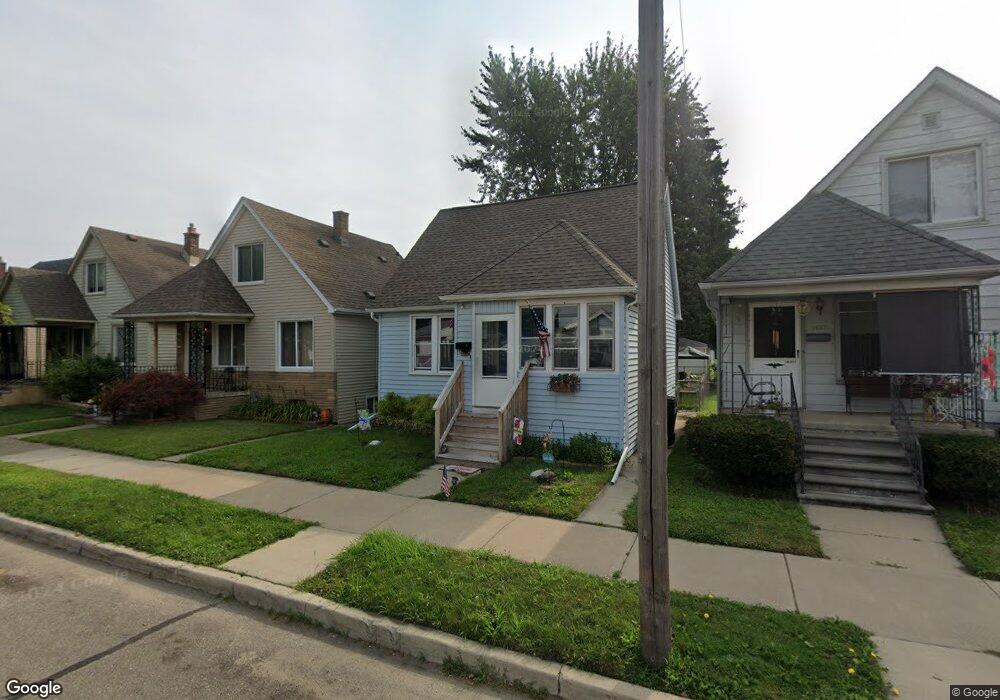
1745 8th St Wyandotte, MI 48192
Estimated Value: $136,000 - $154,000
--
Bed
--
Bath
720
Sq Ft
$200/Sq Ft
Est. Value
About This Home
This home is located at 1745 8th St, Wyandotte, MI 48192 and is currently estimated at $144,052, approximately $200 per square foot. 1745 8th St is a home located in Wayne County with nearby schools including Jefferson Elementary School, Woodrow Wilson School, and Roosevelt High School.
Ownership History
Date
Name
Owned For
Owner Type
Purchase Details
Closed on
Mar 30, 2006
Sold by
Hud
Bought by
Esquivel Juan
Current Estimated Value
Purchase Details
Closed on
May 10, 2005
Sold by
Mortgage Electronic Registration Systems
Bought by
Hud
Purchase Details
Closed on
Nov 3, 2004
Sold by
Torno Scott B
Bought by
Mortgage Electronic Registration Systems
Purchase Details
Closed on
Dec 19, 2003
Sold by
Bergquist Barbara June and Stark Shirley Mae
Bought by
Torno Scott B
Create a Home Valuation Report for This Property
The Home Valuation Report is an in-depth analysis detailing your home's value as well as a comparison with similar homes in the area
Home Values in the Area
Average Home Value in this Area
Purchase History
| Date | Buyer | Sale Price | Title Company |
|---|---|---|---|
| Esquivel Juan | $49,000 | None Available | |
| Hud | -- | None Available | |
| Mortgage Electronic Registration Systems | $83,941 | -- | |
| Torno Scott B | $80,000 | Metropolitan Title Company |
Source: Public Records
Tax History Compared to Growth
Tax History
| Year | Tax Paid | Tax Assessment Tax Assessment Total Assessment is a certain percentage of the fair market value that is determined by local assessors to be the total taxable value of land and additions on the property. | Land | Improvement |
|---|---|---|---|---|
| 2025 | $1,042 | $56,200 | $0 | $0 |
| 2024 | $1,042 | $51,300 | $0 | $0 |
| 2023 | $994 | $46,900 | $0 | $0 |
| 2022 | $1,277 | $41,900 | $0 | $0 |
| 2021 | $1,248 | $37,200 | $0 | $0 |
| 2020 | $1,231 | $33,400 | $0 | $0 |
| 2019 | $1,308 | $31,100 | $0 | $0 |
| 2018 | $874 | $19,700 | $0 | $0 |
| 2017 | $607 | $19,700 | $0 | $0 |
| 2016 | $1,165 | $17,900 | $0 | $0 |
| 2015 | $1,569 | $16,600 | $0 | $0 |
| 2013 | $1,520 | $15,200 | $0 | $0 |
| 2012 | $837 | $15,200 | $3,600 | $11,600 |
Source: Public Records
Map
Nearby Homes