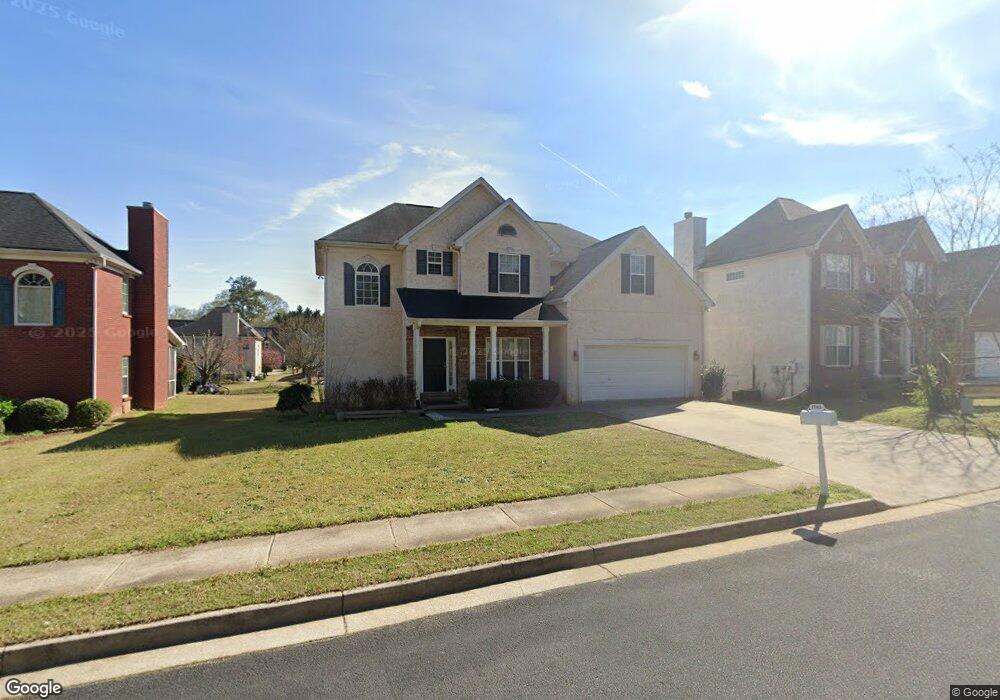
1745 Central Park Way Morrow, GA 30260
Estimated Value: $258,709 - $381,000
4
Beds
3
Baths
2,496
Sq Ft
$123/Sq Ft
Est. Value
About This Home
This home is located at 1745 Central Park Way, Morrow, GA 30260 and is currently estimated at $306,927, approximately $122 per square foot. 1745 Central Park Way is a home located in Clayton County with nearby schools including Morrow Elementary School, Morrow Middle School, and Morrow High School.
Ownership History
Date
Name
Owned For
Owner Type
Purchase Details
Closed on
Oct 17, 2022
Sold by
Nguyen Giang
Bought by
Tran Thi Phuong
Current Estimated Value
Purchase Details
Closed on
Dec 20, 2019
Sold by
Kissack Brian
Bought by
Nguyen Giang and Tran Phuong T
Purchase Details
Closed on
Dec 31, 2007
Sold by
Jong Tee T
Bought by
Kissack Brian
Home Financials for this Owner
Home Financials are based on the most recent Mortgage that was taken out on this home.
Original Mortgage
$161,950
Interest Rate
6.15%
Mortgage Type
New Conventional
Purchase Details
Closed on
Jun 29, 2005
Sold by
Grove Park Homes Llc
Bought by
Jong Tee T
Home Financials for this Owner
Home Financials are based on the most recent Mortgage that was taken out on this home.
Original Mortgage
$158,792
Interest Rate
7.4%
Mortgage Type
New Conventional
Create a Home Valuation Report for This Property
The Home Valuation Report is an in-depth analysis detailing your home's value as well as a comparison with similar homes in the area
Home Values in the Area
Average Home Value in this Area
Purchase History
| Date | Buyer | Sale Price | Title Company |
|---|---|---|---|
| Tran Thi Phuong | -- | -- | |
| Nguyen Giang | $180,000 | -- | |
| Kissack Brian | $110,600 | -- | |
| Jong Tee T | $198,500 | -- |
Source: Public Records
Mortgage History
| Date | Status | Borrower | Loan Amount |
|---|---|---|---|
| Previous Owner | Kissack Brian | $161,950 | |
| Previous Owner | Jong Tee T | $158,792 |
Source: Public Records
Tax History
| Year | Tax Paid | Tax Assessment Tax Assessment Total Assessment is a certain percentage of the fair market value that is determined by local assessors to be the total taxable value of land and additions on the property. | Land | Improvement |
|---|---|---|---|---|
| 2025 | $1,607 | $106,680 | $10,400 | $96,280 |
| 2024 | $1,851 | $107,760 | $10,400 | $97,360 |
| 2023 | $4,110 | $104,120 | $10,400 | $93,720 |
| 2022 | $3,460 | $100,360 | $10,400 | $89,960 |
| 2021 | $2,414 | $75,440 | $10,400 | $65,040 |
| 2020 | $2,526 | $72,000 | $10,400 | $61,600 |
| 2019 | $2,402 | $67,490 | $10,400 | $57,090 |
| 2018 | $2,244 | $63,038 | $10,400 | $52,638 |
| 2017 | $2,232 | $62,544 | $10,400 | $52,144 |
| 2016 | $2,252 | $63,087 | $10,400 | $52,687 |
| 2015 | $2,208 | $0 | $0 | $0 |
| 2014 | $1,936 | $55,674 | $10,400 | $45,274 |
Source: Public Records
Map
Nearby Homes
- 6186 Deans Way
- 6168 Deans Way
- 2275 Santa fe St Unit 25
- 1804 Carla Dr
- 1865 Oxford Dr
- 1924 Mural Cir
- 1893 Stratford Arms Dr
- 5992 Twilight Trail
- 1802 Lake Harbin Rd
- 1931 Cornell Way
- 0 SE Old Rex Morrow Rd Unit 142 8001665
- 6250 Graceland Cir
- 6430 Oakleaf Way
- 2273 Santa fe St Unit 24
- 2318 Santa fe St Unit 4
- 2144 Carriage Dr
- 6541 Debbie Sue Ln
- 6424 Woodstone Way
- 6532 Debbie Sue Ln
- 6425 Woodstone Way
- 1753 Central Park Way
- 1737 Central Park Way Unit 4
- 1851 Central Park Loop
- 1761 Central Park Way
- 1859 Central Park Loop
- 1845 Central Park Loop
- 1907 Central Park Loop
- 1839 Central Park Loop
- 1769 Central Park Way
- 1894 Central Park Loop
- 1888 Central Park Loop
- 1902 Central Park Loop
- 1882 Central Park Loop
- 1913 Central Park Loop
- 1833 Central Park Loop
- 1906 Central Park Loop
- 1876 Central Park Loop
- 1817 Central Park Loop
- 1858 Central Park Loop
- 1852 Central Park Loop
Your Personal Tour Guide
Ask me questions while you tour the home.