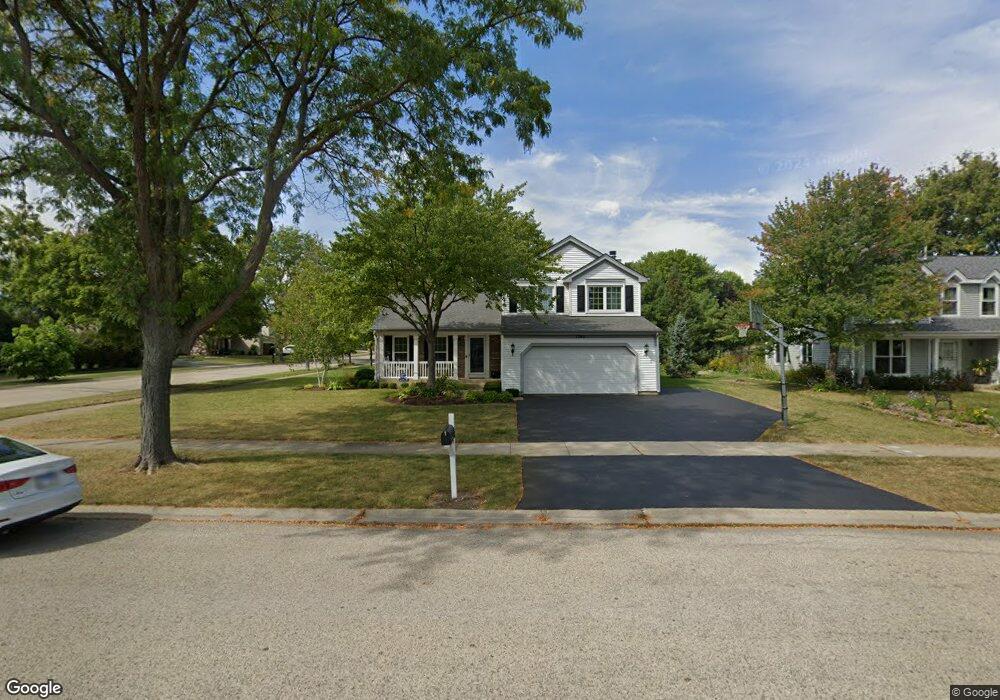
1745 Coral Reef Way Lake Zurich, IL 60047
Estimated Value: $443,998 - $517,000
3
Beds
3
Baths
1,617
Sq Ft
$304/Sq Ft
Est. Value
About This Home
This home is located at 1745 Coral Reef Way, Lake Zurich, IL 60047 and is currently estimated at $491,750, approximately $304 per square foot. 1745 Coral Reef Way is a home located in Lake County with nearby schools including Isaac Fox Elementary School, Lake Zurich Middle School - South Campus, and Lake Zurich High School.
Ownership History
Date
Name
Owned For
Owner Type
Purchase Details
Closed on
Jun 27, 2005
Sold by
Skarbek Matthew E and Skarbek Marilyn
Bought by
Shondy Gary C and Shondy Sherry
Current Estimated Value
Home Financials for this Owner
Home Financials are based on the most recent Mortgage that was taken out on this home.
Original Mortgage
$281,600
Outstanding Balance
$144,235
Interest Rate
5.37%
Mortgage Type
Purchase Money Mortgage
Estimated Equity
$347,515
Purchase Details
Closed on
Jun 5, 2003
Sold by
Barrett Regan Lisa J and Regan Patrick T
Bought by
Skarbek Matthew E and Skarbek Marilyn
Home Financials for this Owner
Home Financials are based on the most recent Mortgage that was taken out on this home.
Original Mortgage
$249,600
Interest Rate
4.75%
Mortgage Type
Purchase Money Mortgage
Purchase Details
Closed on
Oct 31, 1997
Sold by
Barrett William R
Bought by
Barrett Lisa J
Create a Home Valuation Report for This Property
The Home Valuation Report is an in-depth analysis detailing your home's value as well as a comparison with similar homes in the area
Home Values in the Area
Average Home Value in this Area
Purchase History
| Date | Buyer | Sale Price | Title Company |
|---|---|---|---|
| Shondy Gary C | $352,000 | Chicago Title Insurance Comp | |
| Skarbek Matthew E | $312,000 | Ticor | |
| Barrett Lisa J | $25,000 | -- |
Source: Public Records
Mortgage History
| Date | Status | Borrower | Loan Amount |
|---|---|---|---|
| Open | Shondy Gary C | $281,600 | |
| Previous Owner | Skarbek Matthew E | $249,600 | |
| Closed | Skarbek Matthew E | $31,200 |
Source: Public Records
Tax History Compared to Growth
Tax History
| Year | Tax Paid | Tax Assessment Tax Assessment Total Assessment is a certain percentage of the fair market value that is determined by local assessors to be the total taxable value of land and additions on the property. | Land | Improvement |
|---|---|---|---|---|
| 2024 | $8,402 | $120,335 | $26,865 | $93,470 |
| 2023 | $7,538 | $114,806 | $25,630 | $89,176 |
| 2022 | $7,538 | $101,679 | $20,902 | $80,777 |
| 2021 | $7,274 | $99,073 | $20,366 | $78,707 |
| 2020 | $7,142 | $99,073 | $20,366 | $78,707 |
| 2019 | $7,034 | $98,208 | $20,188 | $78,020 |
| 2018 | $7,172 | $100,357 | $21,719 | $78,638 |
| 2017 | $7,122 | $99,147 | $21,457 | $77,690 |
| 2016 | $6,978 | $96,008 | $20,778 | $75,230 |
| 2015 | $6,873 | $91,444 | $19,790 | $71,654 |
| 2014 | $6,347 | $84,023 | $22,331 | $61,692 |
| 2012 | $6,336 | $84,200 | $22,378 | $61,822 |
Source: Public Records
Map
Nearby Homes
- 822 Woodbine Cir
- 21326 N Elder Ct
- 21186 W Preserve Dr
- 20992 W Preserve Dr
- 21355 N Bobwhite Ln
- 23036 W Long Grove Rd
- 21725 N Ashley St
- 21742 N Ashley St
- 20633 N Primrose Ct
- 1202 Tracie Dr
- 22145 W White Pine Rd
- 21704 N Pine Grove Ct
- 20688 N Oliver Ct
- 20678 N Oliver Ct
- 21763 Deerpath Rd
- 22106 W Casa Bella View
- 22110 W Casa Bella View
- 22112 W Casa Bella View
- 22118 W Casa Bella View
- 1254 Tracie Dr
- 1725 Coral Reef Way
- 575 Shallow Cove Rd
- 1765 Coral Reef Way
- 590 Cypress Bridge Rd
- 565 Shallow Cove Rd
- 570 Shallow Cove Rd
- 1744 Coral Reef Way
- 580 Cypress Bridge Rd
- 1785 Coral Reef Way
- 1724 Coral Reef Way
- 560 Shallow Cove Rd
- 555 Shallow Cove Rd
- 1764 Coral Reef Way
- 560 Cypress Bridge Rd
- 1704 Coral Reef Way
- 550 Shallow Cove Rd Unit 2F
- 635 Shallow Cove Rd
- 1784 Coral Reef Way
- 545 Shallow Cove Rd
- 113 W Harbor Dr