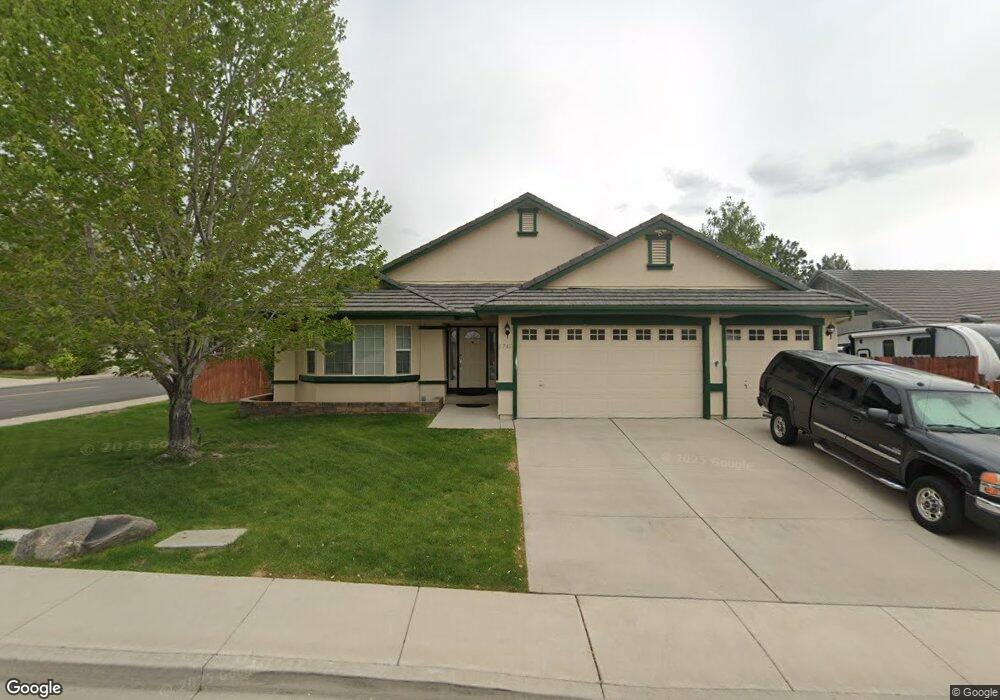
1745 Desert Mountain Dr Sparks, NV 89436
Los Altos Parkway NeighborhoodEstimated Value: $668,000 - $697,000
3
Beds
3
Baths
2,519
Sq Ft
$271/Sq Ft
Est. Value
About This Home
This home is located at 1745 Desert Mountain Dr, Sparks, NV 89436 and is currently estimated at $681,773, approximately $270 per square foot. 1745 Desert Mountain Dr is a home located in Washoe County with nearby schools including Bud Beasley Elementary School, Edward C Reed High School, and Excel Christian School.
Ownership History
Date
Name
Owned For
Owner Type
Purchase Details
Closed on
Jul 5, 2022
Sold by
Nerger Brandi M
Bought by
Nerger Patrick S
Current Estimated Value
Home Financials for this Owner
Home Financials are based on the most recent Mortgage that was taken out on this home.
Original Mortgage
$191,000
Outstanding Balance
$181,715
Interest Rate
5.09%
Mortgage Type
New Conventional
Estimated Equity
$500,058
Purchase Details
Closed on
Feb 25, 2004
Sold by
Nerger Patrick S
Bought by
Nerger Patrick S and Nerger Brandi M
Home Financials for this Owner
Home Financials are based on the most recent Mortgage that was taken out on this home.
Original Mortgage
$204,000
Interest Rate
5.69%
Mortgage Type
New Conventional
Purchase Details
Closed on
Oct 31, 2001
Sold by
Barker Coleman Communities Llc
Bought by
Nerger Patrick S
Home Financials for this Owner
Home Financials are based on the most recent Mortgage that was taken out on this home.
Original Mortgage
$207,700
Interest Rate
6.84%
Create a Home Valuation Report for This Property
The Home Valuation Report is an in-depth analysis detailing your home's value as well as a comparison with similar homes in the area
Home Values in the Area
Average Home Value in this Area
Purchase History
| Date | Buyer | Sale Price | Title Company |
|---|---|---|---|
| Nerger Patrick S | -- | First Integrity Title | |
| Nerger Patrick S | -- | First American Title | |
| Nerger Patrick S | $260,000 | Stewart Title Northern Nevad |
Source: Public Records
Mortgage History
| Date | Status | Borrower | Loan Amount |
|---|---|---|---|
| Open | Nerger Patrick S | $191,000 | |
| Previous Owner | Nerger Patrick S | $204,000 | |
| Previous Owner | Nerger Patrick S | $207,700 |
Source: Public Records
Tax History Compared to Growth
Tax History
| Year | Tax Paid | Tax Assessment Tax Assessment Total Assessment is a certain percentage of the fair market value that is determined by local assessors to be the total taxable value of land and additions on the property. | Land | Improvement |
|---|---|---|---|---|
| 2025 | $3,429 | $159,712 | $43,120 | $116,592 |
| 2024 | $3,429 | $155,211 | $37,555 | $117,656 |
| 2023 | $3,330 | $151,582 | $40,180 | $111,402 |
| 2022 | $3,236 | $125,562 | $32,865 | $92,698 |
| 2021 | $3,141 | $120,388 | $28,035 | $92,353 |
| 2020 | $3,048 | $119,929 | $27,405 | $92,524 |
| 2019 | $2,960 | $116,106 | $26,600 | $89,506 |
| 2018 | $2,875 | $107,182 | $19,740 | $87,442 |
| 2017 | $2,790 | $107,321 | $19,740 | $87,581 |
| 2016 | $2,718 | $108,939 | $19,390 | $89,549 |
| 2015 | $2,714 | $97,073 | $15,855 | $81,218 |
| 2014 | $2,635 | $89,828 | $13,860 | $75,968 |
| 2013 | -- | $67,881 | $10,640 | $57,241 |
Source: Public Records
Map
Nearby Homes
- 1850 Almonte Ct
- 4393 Acobat Ct
- 4675 Firtree Ln
- 4383 Setting Sun Ct Unit 1
- 1557 Satellite Dr
- 1484 Serendipity Ct
- 1475 Golddust Dr
- 1550 Istrice Rd
- 1685 Southview Dr
- 1560 Freeman Way
- 4601 N Cactus Hills Ct
- 2411 Tecumseh Way Unit 12
- 2415 Tecumseh Way
- 2427 Tecumseh Way Unit 8
- 3324 Danville Dr
- 1357 Silver View Cir
- 3221 Myles Dr
- 2316 Isabella Ct
- 3238 Candelaria Dr
- 3345 Groom Way
- 1735 Desert Mountain Dr
- 4349 Cantamar Ct
- 4350 Cantamar Ct
- 1725 Desert Mountain Dr
- 4342 Cantamar Ct
- 1740 Desert Mountain Dr
- 4329 Cantamar Ct
- 1760 Desert Mountain Dr
- 4334 Cantamar Ct
- 1715 Desert Mountain Dr
- 1775 Desert Mountain Dr
- 4405 Black Diamond Dr
- 1770 Desert Mountain Dr
- 4319 Cantamar Ct
- 4326 Cantamar Ct
- 1751 Braidwood Dr
- 4415 Black Diamond Dr
- 1780 Desert Mountain Dr
- 1785 Desert Mountain Dr
- 4314 Desert Hills Dr