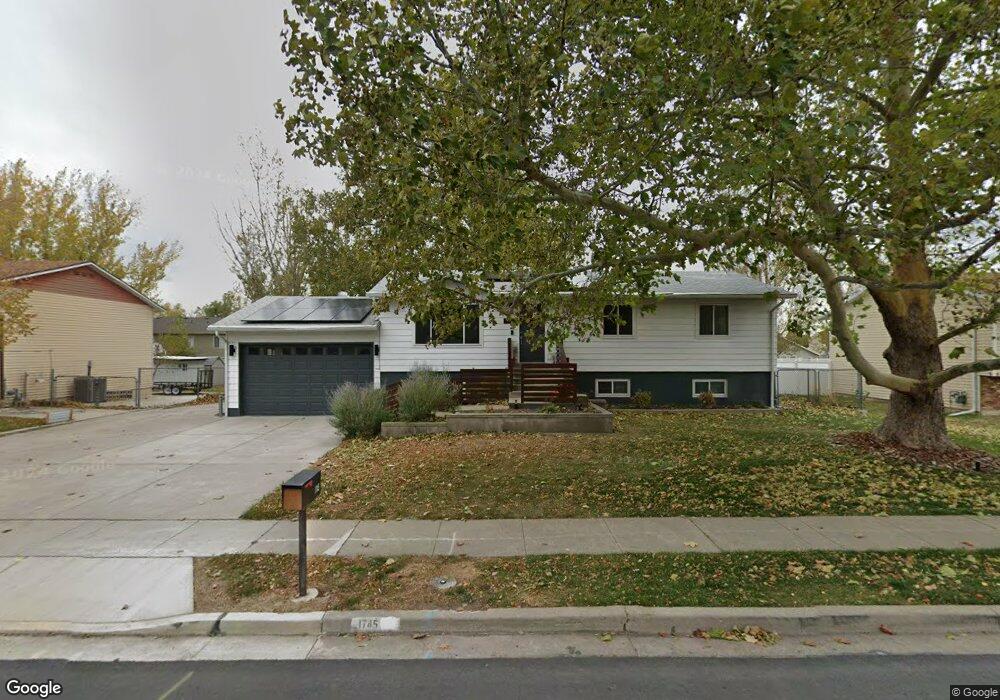
1745 N 600 W West Bountiful, UT 84087
Estimated Value: $529,000 - $781,000
5
Beds
4
Baths
2,830
Sq Ft
$223/Sq Ft
Est. Value
About This Home
This home is located at 1745 N 600 W, West Bountiful, UT 84087 and is currently estimated at $630,376, approximately $222 per square foot. 1745 N 600 W is a home located in Davis County with nearby schools including West Bountiful Elementary School, Bountiful Junior High School, and Viewmont High School.
Ownership History
Date
Name
Owned For
Owner Type
Purchase Details
Closed on
Jul 6, 2021
Sold by
Call Kenzie and Call Skyler
Bought by
Winegar Austin
Current Estimated Value
Home Financials for this Owner
Home Financials are based on the most recent Mortgage that was taken out on this home.
Original Mortgage
$538,650
Outstanding Balance
$487,680
Interest Rate
2.9%
Mortgage Type
New Conventional
Estimated Equity
$142,696
Purchase Details
Closed on
Aug 13, 2018
Sold by
Kenison Lynn T
Bought by
Call Kenzie and Call Skyler
Purchase Details
Closed on
Feb 26, 2018
Sold by
Kenison Lynn T and Kenison Daralyn W
Bought by
Call Kenzie and Call Skyler
Home Financials for this Owner
Home Financials are based on the most recent Mortgage that was taken out on this home.
Original Mortgage
$288,963
Interest Rate
3.99%
Mortgage Type
New Conventional
Purchase Details
Closed on
Jun 5, 2005
Sold by
Kenison Lynn T and Kenison Daralyn W
Bought by
Kenison Lynn T and Kenison Daralyn W
Create a Home Valuation Report for This Property
The Home Valuation Report is an in-depth analysis detailing your home's value as well as a comparison with similar homes in the area
Home Values in the Area
Average Home Value in this Area
Purchase History
| Date | Buyer | Sale Price | Title Company |
|---|---|---|---|
| Winegar Austin | -- | Lydolph & Weierholt Title | |
| Call Kenzie | -- | Vanguard Title | |
| Call Kenzie | -- | Vanguard Title | |
| Kenison Lynn T | -- | -- |
Source: Public Records
Mortgage History
| Date | Status | Borrower | Loan Amount |
|---|---|---|---|
| Open | Winegar Austin | $538,650 | |
| Previous Owner | Call Kenzie | $288,963 |
Source: Public Records
Tax History Compared to Growth
Tax History
| Year | Tax Paid | Tax Assessment Tax Assessment Total Assessment is a certain percentage of the fair market value that is determined by local assessors to be the total taxable value of land and additions on the property. | Land | Improvement |
|---|---|---|---|---|
| 2025 | $3,331 | $293,150 | $141,334 | $151,816 |
| 2024 | $3,115 | $280,500 | $116,261 | $164,239 |
| 2023 | $3,107 | $514,000 | $219,666 | $294,334 |
| 2022 | $3,240 | $300,300 | $105,579 | $194,721 |
| 2021 | $2,558 | $361,000 | $142,825 | $218,175 |
| 2020 | $2,286 | $319,000 | $132,208 | $186,792 |
| 2019 | $2,224 | $307,000 | $133,147 | $173,853 |
| 2018 | $2,080 | $283,000 | $132,955 | $150,045 |
| 2016 | $1,720 | $126,665 | $35,209 | $91,456 |
| 2015 | $1,637 | $114,510 | $35,209 | $79,301 |
| 2014 | $1,777 | $128,172 | $35,209 | $92,963 |
| 2013 | -- | $100,303 | $31,538 | $68,765 |
Source: Public Records
Map
Nearby Homes
- 637 W 1600 N
- 580 W 2125 N
- 789 W 1950 N
- Lincoln Farmhouse Plan at Belmont Farms
- Belmont Traditional Plan at Belmont Farms
- Hampton Traditional Plan at Belmont Farms
- 2035 N 800 W
- 1503 N 300 W
- 239 Lyman Ln
- 234 Leah Cir
- 215 Lyman Ln
- 204 Lyman Ln
- 825 W 1320 N
- 420 Rawlins Cir
- 2257 N 830 W
- 1552 N 200 W
- 2339 N 800 W
- 235 W 1400 N
- 1410 N 200 W
- 366 W 1000 N