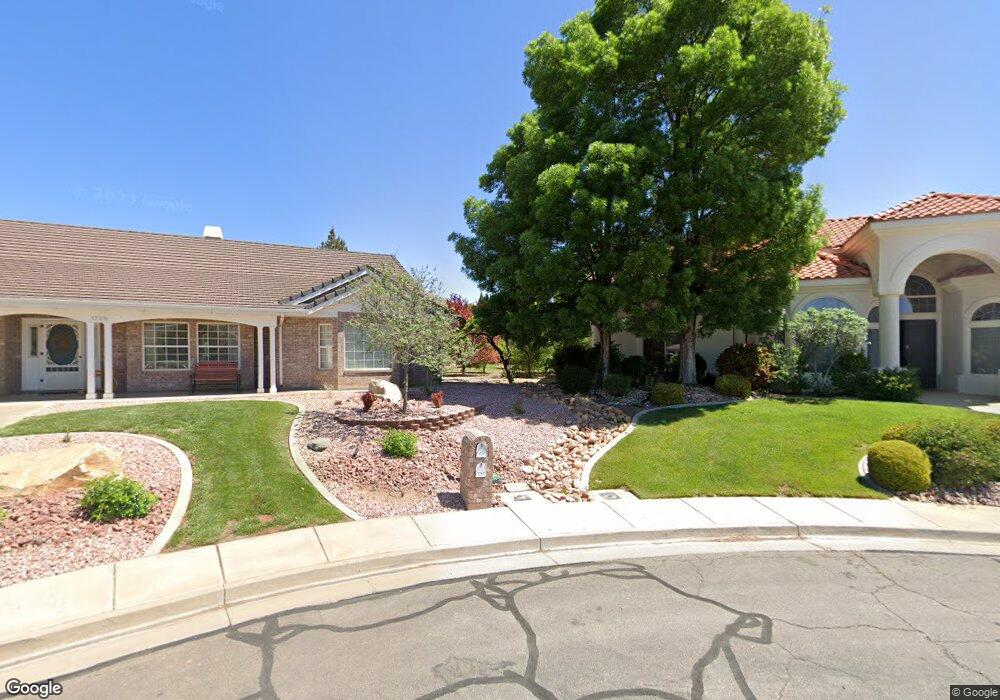
1745 S Cottam Ct St. George, UT 84790
Estimated Value: $837,000 - $1,186,000
5
Beds
5
Baths
4,650
Sq Ft
$222/Sq Ft
Est. Value
About This Home
This home is located at 1745 S Cottam Ct, St. George, UT 84790 and is currently estimated at $1,030,457, approximately $221 per square foot. 1745 S Cottam Ct is a home located in Washington County with nearby schools including Bloomington Hills Elementary School, Sunrise Ridge Intermediate School, and Desert Hills Middle School.
Ownership History
Date
Name
Owned For
Owner Type
Purchase Details
Closed on
Apr 27, 2021
Sold by
S & L Acreage Llc
Bought by
Liston Larry and Liston Madelyn C
Current Estimated Value
Home Financials for this Owner
Home Financials are based on the most recent Mortgage that was taken out on this home.
Original Mortgage
$548,250
Outstanding Balance
$496,851
Interest Rate
3.1%
Mortgage Type
New Conventional
Estimated Equity
$533,606
Purchase Details
Closed on
Mar 5, 2021
Sold by
Porter Stuart and Porter Lezlee
Bought by
S & L Acreage Llc
Home Financials for this Owner
Home Financials are based on the most recent Mortgage that was taken out on this home.
Original Mortgage
$548,250
Outstanding Balance
$496,851
Interest Rate
3.1%
Mortgage Type
New Conventional
Estimated Equity
$533,606
Purchase Details
Closed on
Jun 30, 2020
Sold by
Porter Stuart and Porter Lezlee
Bought by
Porter Stuart and Porter Lezlee
Create a Home Valuation Report for This Property
The Home Valuation Report is an in-depth analysis detailing your home's value as well as a comparison with similar homes in the area
Home Values in the Area
Average Home Value in this Area
Purchase History
| Date | Buyer | Sale Price | Title Company |
|---|---|---|---|
| Liston Larry | -- | Vanguard Title Insurance Age | |
| S & L Acreage Llc | -- | Southern Utah Title Co | |
| Porter Stuart | -- | None Available |
Source: Public Records
Mortgage History
| Date | Status | Borrower | Loan Amount |
|---|---|---|---|
| Open | Liston Larry | $548,250 |
Source: Public Records
Tax History Compared to Growth
Tax History
| Year | Tax Paid | Tax Assessment Tax Assessment Total Assessment is a certain percentage of the fair market value that is determined by local assessors to be the total taxable value of land and additions on the property. | Land | Improvement |
|---|---|---|---|---|
| 2025 | $7,295 | $1,078,100 | $176,000 | $902,100 |
| 2023 | $7,133 | $1,065,800 | $154,000 | $911,800 |
| 2022 | $8,128 | $1,142,000 | $132,000 | $1,010,000 |
| 2021 | $3,120 | $793,100 | $121,000 | $672,100 |
| 2020 | $3,632 | $716,700 | $115,500 | $601,200 |
| 2019 | $3,613 | $696,600 | $115,500 | $581,100 |
| 2018 | $3,384 | $327,030 | $0 | $0 |
| 2017 | $3,088 | $298,485 | $0 | $0 |
| 2016 | $3,267 | $291,995 | $0 | $0 |
| 2015 | $3,253 | $278,960 | $0 | $0 |
| 2014 | $3,215 | $277,420 | $0 | $0 |
Source: Public Records
Map
Nearby Homes
- 1790 S River Rd
- 1118 Lizzie Ln
- 1659 S Cobblestone Ln
- 1365 E Fort Pierce Dr Unit 9
- 1546 E 1850 S
- 1620 E 1450 S Unit 14
- 1180 Hubbard Place
- 2045 S 1400 E Unit 14
- 2045 S 1400 E Unit 10
- 2045 S 1400 E Unit 13
- 1523 E Talus Way
- Cambria Plan at Cottam Cove
- Scarlett Plan at Cottam Cove
- Bryce Plan at Cottam Cove
- Belmont II Plan at Cottam Cove
- Bentley Plan at Cottam Cove
- Mesa Plan at Cottam Cove
- Bayhill II Plan at Cottam Cove
- Vermont Plan at Cottam Cove
- 1816 Boulder Cove Cir
- 1745 Cottam Ct
- 1280 E 1710 S
- 1739 Cottam Ct
- 1275 E 1710 S
- 1880 E Yant Flat Dr
- 3176 E Rimrunner Dr
- 3083 E Crimson Meadows Dr
- 6213 S Zelda Dr
- 1914 E Yant Flat Dr
- 1283 E 1710 S
- 1733 Cottam Ct
- 1742 Cottam Ct
- 1294 E 1710 S
- 1748 Cottam Ct
- 1252 Saint James Ln
- 1266 Saint James Ln
- 1756 Cottam Ct
- 1297 E 1710 S
- 1234 Saint James Ln
- 1284 Saint James Ln