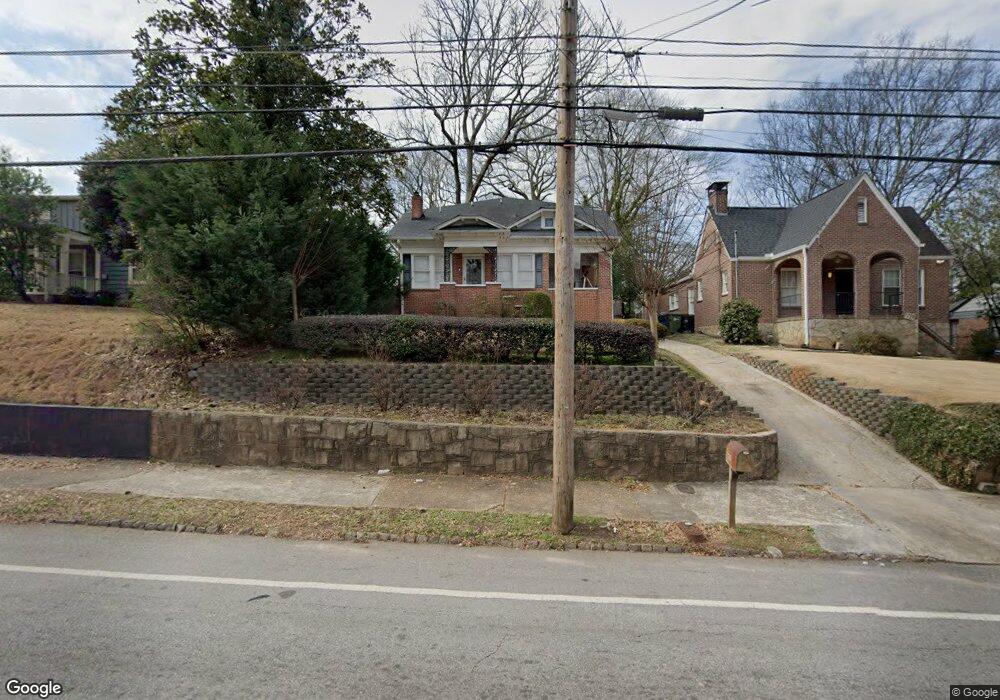
1745 Sylvan Rd SW Atlanta, GA 30310
Sylvan Hills NeighborhoodEstimated Value: $316,000 - $399,000
4
Beds
1
Bath
2,376
Sq Ft
$146/Sq Ft
Est. Value
About This Home
This home is located at 1745 Sylvan Rd SW, Atlanta, GA 30310 and is currently estimated at $348,071, approximately $146 per square foot. 1745 Sylvan Rd SW is a home located in Fulton County with nearby schools including Perkerson Elementary School, Sylvan Hills Middle School, and Carver High School.
Ownership History
Date
Name
Owned For
Owner Type
Purchase Details
Closed on
Dec 20, 2024
Sold by
Grant Jasmine
Bought by
Grant Hibler Jasmine N V Tr and Hibler Brian N Tr
Current Estimated Value
Purchase Details
Closed on
Mar 21, 2005
Sold by
Seeby Justin and Seeby Gabrielle
Bought by
Grant Jasmine
Home Financials for this Owner
Home Financials are based on the most recent Mortgage that was taken out on this home.
Original Mortgage
$163,500
Interest Rate
7.18%
Mortgage Type
New Conventional
Purchase Details
Closed on
Oct 29, 2002
Sold by
Seeby Gabrielle
Bought by
Seeby Gabrielle and Seeby Justin
Purchase Details
Closed on
Oct 19, 2001
Sold by
Neeley Theresa
Bought by
Seeby Justin and Seeby Garbrielle
Home Financials for this Owner
Home Financials are based on the most recent Mortgage that was taken out on this home.
Original Mortgage
$104,000
Interest Rate
6.85%
Mortgage Type
New Conventional
Purchase Details
Closed on
Nov 3, 1994
Sold by
Gardens Troy Inc
Bought by
Neeley Theresa
Purchase Details
Closed on
Aug 17, 1994
Sold by
Owen Clemie
Bought by
Troy Gardens Inc
Create a Home Valuation Report for This Property
The Home Valuation Report is an in-depth analysis detailing your home's value as well as a comparison with similar homes in the area
Home Values in the Area
Average Home Value in this Area
Purchase History
| Date | Buyer | Sale Price | Title Company |
|---|---|---|---|
| Grant Hibler Jasmine N V Tr | -- | -- | |
| Grant Jasmine | $163,500 | -- | |
| Seeby Gabrielle | -- | -- | |
| Seeby Justin | $130,000 | -- | |
| Neeley Theresa | $57,800 | -- | |
| Troy Gardens Inc | $19,000 | -- |
Source: Public Records
Mortgage History
| Date | Status | Borrower | Loan Amount |
|---|---|---|---|
| Previous Owner | Grant Jasmine | $163,500 | |
| Previous Owner | Seeby Justin | $104,000 | |
| Closed | Neeley Theresa | -- |
Source: Public Records
Tax History Compared to Growth
Tax History
| Year | Tax Paid | Tax Assessment Tax Assessment Total Assessment is a certain percentage of the fair market value that is determined by local assessors to be the total taxable value of land and additions on the property. | Land | Improvement |
|---|---|---|---|---|
| 2025 | $2,936 | $154,000 | $45,440 | $108,560 |
| 2023 | $6,747 | $162,960 | $45,440 | $117,520 |
| 2022 | $3,451 | $136,480 | $23,320 | $113,160 |
| 2021 | $425 | $73,880 | $12,360 | $61,520 |
| 2020 | $1,051 | $73,000 | $12,200 | $60,800 |
| 2019 | $485 | $44,480 | $9,280 | $35,200 |
| 2018 | $55 | $25,880 | $4,680 | $21,200 |
| 2017 | $30 | $17,200 | $2,840 | $14,360 |
| 2016 | $30 | $17,200 | $2,840 | $14,360 |
| 2015 | $500 | $17,200 | $2,840 | $14,360 |
| 2014 | $29 | $17,200 | $2,840 | $14,360 |
Source: Public Records
Map
Nearby Homes
- 939 Hope Dr SW
- 1775 Buckeye St SW
- 1807 Sylvan Rd SW
- 1810 Sylvan Rd SW
- 0 Birch St SW Unit 10510978
- 879 Sylvan Place SW
- 1847 Sylvan Rd SW
- 1848 Brandywine St SW
- 1740 Langston Ave SW
- 1798 Evans Dr SW
- 1653 Sylvan Rd SW
- 1875 Langston Ave SW
- 984 Woodbourne Dr SW
- 1696 Langston Ave SW
- 1899 Brandywine St SW
- 1766 Brewer Blvd SW
- 1907 Langston Ave SW
- 1739 Sylvan Rd SW
- 1751 Sylvan Rd SW
- 1733 Sylvan Rd SW
- 933 Hope Dr SW
- 934 Victory Dr SW
- 1729 Sylvan Rd SW
- 939 Hope Dr SW
- 940 Victory Dr SW
- 1763 Sylvan Rd SW
- 1750 Sylvan Rd SW
- 1740 Sylvan Rd SW
- 945 Hope Dr SW
- 0 Sylvan Rd Unit 5963734
- 0 Sylvan Rd Unit 8323833
- 0 Sylvan Rd Unit 7465625
- 0 Sylvan Rd Unit 8003326
- 0 Sylvan Rd Unit 8118739
- 0 Sylvan Rd Unit 8659501
- 0 Sylvan Rd Unit 7304265
- 0 Sylvan Rd Unit 7511483