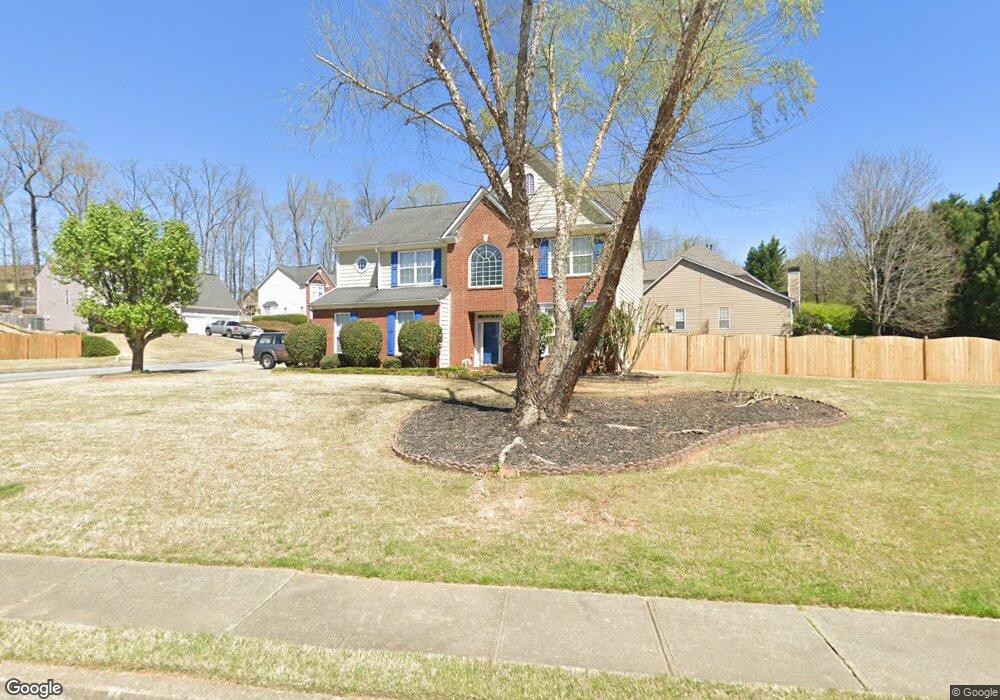
1745 Trellis Place Alpharetta, GA 30004
Estimated Value: $550,000 - $608,000
4
Beds
3
Baths
2,397
Sq Ft
$245/Sq Ft
Est. Value
About This Home
This home is located at 1745 Trellis Place, Alpharetta, GA 30004 and is currently estimated at $586,987, approximately $244 per square foot. 1745 Trellis Place is a home located in Forsyth County with nearby schools including Brandywine Elementary School, DeSana Middle School, and Denmark High School.
Ownership History
Date
Name
Owned For
Owner Type
Purchase Details
Closed on
Jun 8, 2012
Sold by
Laocharoen Kanchana
Bought by
Laocharoen Kamolsil
Current Estimated Value
Purchase Details
Closed on
Sep 7, 2000
Sold by
Shook Jennifer L
Bought by
Lao and Lao Charoen Kmaolsil
Home Financials for this Owner
Home Financials are based on the most recent Mortgage that was taken out on this home.
Original Mortgage
$157,500
Interest Rate
7.96%
Mortgage Type
New Conventional
Purchase Details
Closed on
Feb 22, 2000
Sold by
Shook Jennifer L
Bought by
Shook Jennifer L
Purchase Details
Closed on
Nov 30, 1998
Sold by
Dr Horton Inc
Bought by
Shook Jennifer L
Home Financials for this Owner
Home Financials are based on the most recent Mortgage that was taken out on this home.
Original Mortgage
$169,750
Interest Rate
6.9%
Mortgage Type
New Conventional
Create a Home Valuation Report for This Property
The Home Valuation Report is an in-depth analysis detailing your home's value as well as a comparison with similar homes in the area
Home Values in the Area
Average Home Value in this Area
Purchase History
| Date | Buyer | Sale Price | Title Company |
|---|---|---|---|
| Laocharoen Kamolsil | -- | -- | |
| Lao | $196,900 | -- | |
| Shook Jennifer L | -- | -- | |
| Shook Jennifer L | $179,100 | -- |
Source: Public Records
Mortgage History
| Date | Status | Borrower | Loan Amount |
|---|---|---|---|
| Previous Owner | Lao | $157,500 | |
| Previous Owner | Shook Jennifer L | $169,750 |
Source: Public Records
Tax History Compared to Growth
Tax History
| Year | Tax Paid | Tax Assessment Tax Assessment Total Assessment is a certain percentage of the fair market value that is determined by local assessors to be the total taxable value of land and additions on the property. | Land | Improvement |
|---|---|---|---|---|
| 2025 | $529 | $217,156 | $68,000 | $149,156 |
| 2024 | $529 | $213,164 | $68,000 | $145,164 |
| 2023 | $438 | $194,244 | $60,000 | $134,244 |
| 2022 | $523 | $124,700 | $40,000 | $84,700 |
| 2021 | $499 | $124,700 | $40,000 | $84,700 |
| 2020 | $2,847 | $121,036 | $40,000 | $81,036 |
| 2019 | $2,839 | $120,372 | $40,000 | $80,372 |
| 2018 | $2,581 | $107,068 | $32,000 | $75,068 |
| 2017 | $2,418 | $98,844 | $32,000 | $66,844 |
| 2016 | $2,183 | $87,724 | $24,000 | $63,724 |
| 2015 | $2,145 | $85,724 | $22,000 | $63,724 |
| 2014 | -- | $77,700 | $22,000 | $55,700 |
Source: Public Records
Map
Nearby Homes
- 1405 Overland Crossing
- 1245 Overland Crossing
- 1620 Woodall View Ct
- 1293 Dalesford Dr
- 1480 Waverly Glen Dr
- 1255 Faircrest Crossing Dr
- 255 White Pines Dr
- 1570 Winshire Cove
- 1345 Faircrest Ln
- 1425 Faircrest Ln
- 1550 Township Cir
- 1130 Pennington View Ln
- 472 Grayson Way
- 419 Grayson Way
- 845 Miranda Terrace
- 520 Walden Glen Ln
- 368 Grayson Way
- 1735 Trellis Place Unit Ga1210
- 1735 Trellis Place
- 1735 Trellis Place Unit GA12103
- 2430 Highland Pass
- 2435 Highland Pass
- 1750 Trellis Place
- 2505 Highland Pass
- 1740 Trellis Place
- 2420 Highland Pass
- 1625 Trellis Crossing
- 2425 Highland Pass
- 1730 Trellis Place
- 0 Highland Pass Unit 8887499
- 0 Highland Pass Unit 8128256
- 0 Highland Pass Unit 7327999
- 0 Highland Pass Unit 9070718
- 0 Highland Pass Unit 8827207
- 0 Highland Pass Unit 3206171
- 0 Highland Pass Unit 3237881
- 0 Highland Pass Unit 3235166