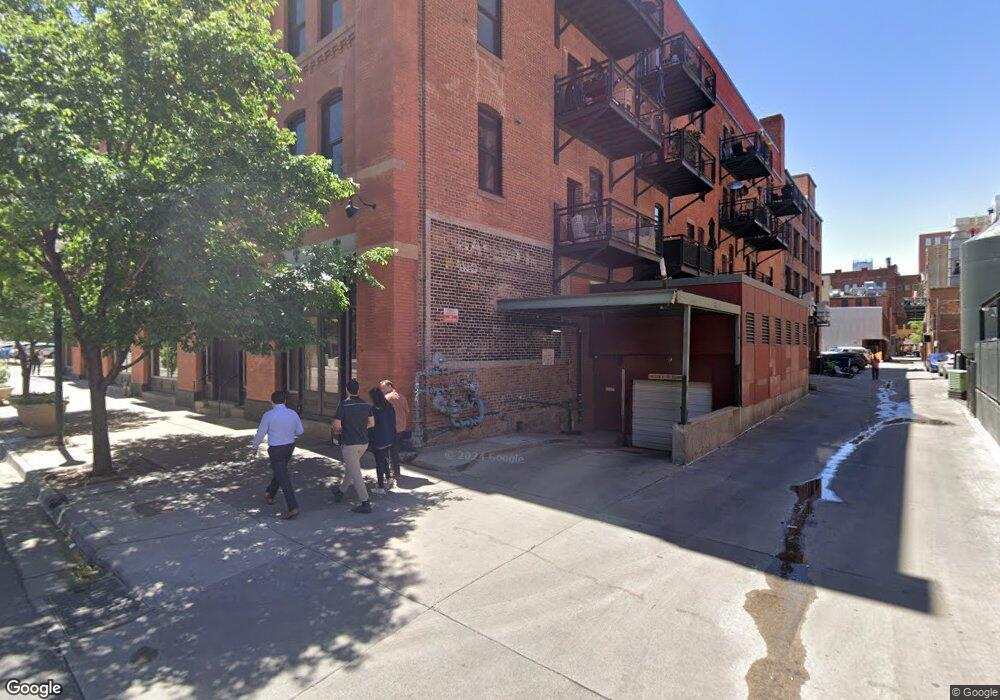
1745 Wazee St Unit 4E Denver, CO 80202
Lower Downtown NeighborhoodEstimated Value: $614,000 - $918,000
2
Beds
2
Baths
1,527
Sq Ft
$483/Sq Ft
Est. Value
About This Home
This home is located at 1745 Wazee St Unit 4E, Denver, CO 80202 and is currently estimated at $738,100, approximately $483 per square foot. 1745 Wazee St Unit 4E is a home located in Denver County with nearby schools including Greenlee Elementary School, Kepner Beacon Middle School, and West High School.
Ownership History
Date
Name
Owned For
Owner Type
Purchase Details
Closed on
Sep 15, 2015
Sold by
Larson Lucas M and Larson Robin
Bought by
Larson Lucas M
Current Estimated Value
Purchase Details
Closed on
May 12, 2009
Sold by
Franklin Loft Llc
Bought by
Larson Lucas M and Larson Robin
Home Financials for this Owner
Home Financials are based on the most recent Mortgage that was taken out on this home.
Original Mortgage
$230,000
Interest Rate
4.77%
Mortgage Type
Purchase Money Mortgage
Purchase Details
Closed on
Nov 5, 2001
Sold by
Berkow Steven A
Bought by
Friedman Gary A
Home Financials for this Owner
Home Financials are based on the most recent Mortgage that was taken out on this home.
Original Mortgage
$318,400
Interest Rate
5.87%
Purchase Details
Closed on
Feb 1, 2000
Sold by
1745 Wazee Llc
Bought by
Berkow Steven A
Home Financials for this Owner
Home Financials are based on the most recent Mortgage that was taken out on this home.
Original Mortgage
$220,000
Interest Rate
7.95%
Create a Home Valuation Report for This Property
The Home Valuation Report is an in-depth analysis detailing your home's value as well as a comparison with similar homes in the area
Home Values in the Area
Average Home Value in this Area
Purchase History
| Date | Buyer | Sale Price | Title Company |
|---|---|---|---|
| Larson Lucas M | -- | None Available | |
| Larson Lucas M | $445,000 | Land Title Guarantee Company | |
| Friedman Gary A | $398,000 | Chicago Title Company | |
| Berkow Steven A | $294,500 | -- |
Source: Public Records
Mortgage History
| Date | Status | Borrower | Loan Amount |
|---|---|---|---|
| Closed | Larson Lucas M | $230,000 | |
| Previous Owner | Friedman Gary A | $318,400 | |
| Previous Owner | Berkow Steven A | $220,000 |
Source: Public Records
Tax History
| Year | Tax Paid | Tax Assessment Tax Assessment Total Assessment is a certain percentage of the fair market value that is determined by local assessors to be the total taxable value of land and additions on the property. | Land | Improvement |
|---|---|---|---|---|
| 2025 | $3,863 | $53,700 | $8,440 | $8,440 |
| 2024 | $3,863 | $48,780 | $5,000 | $43,780 |
| 2023 | $3,780 | $48,780 | $5,000 | $43,780 |
| 2022 | $3,754 | $47,200 | $9,010 | $38,190 |
| 2021 | $3,623 | $48,560 | $9,270 | $39,290 |
| 2020 | $3,633 | $48,970 | $8,560 | $40,410 |
| 2019 | $3,532 | $48,970 | $8,560 | $40,410 |
| 2018 | $3,339 | $43,160 | $5,750 | $37,410 |
| 2017 | $3,329 | $43,160 | $5,750 | $37,410 |
| 2016 | $3,478 | $42,650 | $5,397 | $37,253 |
| 2015 | $3,332 | $42,650 | $5,397 | $37,253 |
| 2014 | $3,628 | $43,680 | $6,479 | $37,201 |
Source: Public Records
Map
Nearby Homes
- 1745 Wazee St Unit 3C
- 1745 Wazee St Unit 4C
- 1792 Wynkoop St Unit 307
- 1720 Wazee St Unit 2B
- 1801 Wynkoop St Unit 203
- 1801 Wynkoop St Unit 603
- 1890 Wynkoop St Unit 805
- 1890 Wynkoop St Unit 604
- 1890 Wynkoop St Unit 603
- 1863 Wazee St Unit 6E
- 1748 Blake St
- 1901 Wazee St Unit 815
- 1901 Wazee St Unit 618
- 1901 Wazee St Unit 412
- 1901 Wazee St Unit 507
- 1901 Wazee St Unit 304
- 1901 Wazee St Unit 311
- 1901 Wazee St Unit 515
- 1901 Wazee St Unit 704
- 1750 Wewatta St Unit 1230
- 1745 Wazee St
- 1745 Wazee St Unit 5H
- 1745 Wazee St Unit 5G
- 1745 Wazee St Unit 5F
- 1745 Wazee St Unit 5D
- 1745 Wazee St Unit 5C
- 1745 Wazee St
- 1745 Wazee St
- 1745 Wazee St Unit 4H
- 1745 Wazee St Unit 4F
- 1745 Wazee St
- 1745 Wazee St Unit 4B
- 1745 Wazee St
- 1745 Wazee St Unit 3H
- 1745 Wazee St
- 1745 Wazee St Unit 3F
- 1745 Wazee St
- 1745 Wazee St Unit 3D
- 1745 Wazee St
- 1745 Wazee St Unit 3B
Your Personal Tour Guide
Ask me questions while you tour the home.