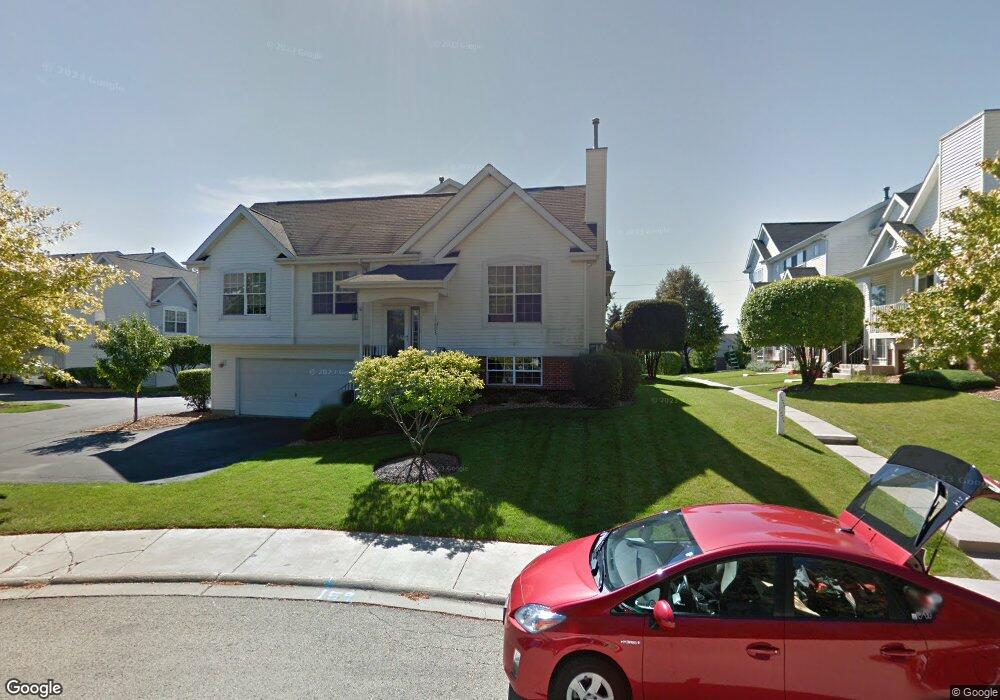
17457 Teton Cir Unit 3 Lockport, IL 60441
Estimated Value: $275,413 - $289,000
2
Beds
2
Baths
1,273
Sq Ft
$222/Sq Ft
Est. Value
About This Home
This home is located at 17457 Teton Cir Unit 3, Lockport, IL 60441 and is currently estimated at $282,353, approximately $221 per square foot. 17457 Teton Cir Unit 3 is a home located in Will County with nearby schools including William J. Butler, Hadley Middle School, and Homer Jr High School.
Ownership History
Date
Name
Owned For
Owner Type
Purchase Details
Closed on
Dec 14, 2021
Sold by
Hayes Shaun and Hayes Andrea
Bought by
Linhart Casey
Current Estimated Value
Home Financials for this Owner
Home Financials are based on the most recent Mortgage that was taken out on this home.
Original Mortgage
$203,000
Outstanding Balance
$187,054
Interest Rate
3.25%
Mortgage Type
New Conventional
Estimated Equity
$95,299
Purchase Details
Closed on
Aug 23, 2007
Sold by
Zeug Christopher A and Zeug Jennifer
Bought by
Hayes Shawn A and Hayes Andrea M
Home Financials for this Owner
Home Financials are based on the most recent Mortgage that was taken out on this home.
Original Mortgage
$169,000
Interest Rate
6.72%
Mortgage Type
Purchase Money Mortgage
Purchase Details
Closed on
Jun 2, 1997
Sold by
Standard Bank & Trust Company
Bought by
Zeug Christopher A
Home Financials for this Owner
Home Financials are based on the most recent Mortgage that was taken out on this home.
Original Mortgage
$109,000
Interest Rate
8.01%
Create a Home Valuation Report for This Property
The Home Valuation Report is an in-depth analysis detailing your home's value as well as a comparison with similar homes in the area
Home Values in the Area
Average Home Value in this Area
Purchase History
| Date | Buyer | Sale Price | Title Company |
|---|---|---|---|
| Linhart Casey | $215,000 | Fidelity National Title | |
| Hayes Shawn A | $179,000 | Cti | |
| Zeug Christopher A | $120,500 | Chicago Title Insurance Co |
Source: Public Records
Mortgage History
| Date | Status | Borrower | Loan Amount |
|---|---|---|---|
| Open | Linhart Casey | $203,000 | |
| Previous Owner | Hayes Shawn A | $169,000 | |
| Previous Owner | Zeug Christopher A | $109,000 |
Source: Public Records
Tax History Compared to Growth
Tax History
| Year | Tax Paid | Tax Assessment Tax Assessment Total Assessment is a certain percentage of the fair market value that is determined by local assessors to be the total taxable value of land and additions on the property. | Land | Improvement |
|---|---|---|---|---|
| 2024 | $5,967 | $76,135 | $13,001 | $63,134 |
| 2023 | $5,967 | $69,013 | $11,785 | $57,228 |
| 2022 | $4,728 | $56,251 | $10,189 | $46,062 |
| 2021 | $4,499 | $53,293 | $9,653 | $43,640 |
| 2020 | $4,470 | $51,332 | $9,298 | $42,034 |
| 2019 | $4,290 | $49,382 | $8,945 | $40,437 |
| 2018 | $4,185 | $47,651 | $8,842 | $38,809 |
| 2017 | $4,111 | $46,317 | $8,594 | $37,723 |
| 2016 | $4,010 | $44,772 | $8,307 | $36,465 |
| 2015 | $3,905 | $43,091 | $7,995 | $35,096 |
| 2014 | $3,905 | $42,340 | $7,830 | $34,510 |
| 2013 | $3,905 | $42,340 | $7,830 | $34,510 |
Source: Public Records
Map
Nearby Homes
- 17437 Yakima Dr
- 16556 Willow Walk Dr
- 17526 S Gilbert Dr Unit 302D
- 17542 Gilbert Dr Unit 404D
- 17612 S Gilbert Dr
- 17326 Long Bow Dr
- 16335 Cagwin Dr Unit 2
- 16623 W Natoma Dr Unit 16623
- 17302 Long Bow Dr
- 17241 Arrow Head Dr
- 17234 Long Bow Dr
- 17211 S Huron Ct
- 17825 S Alta Dr
- 16125-45 Bruce Rd
- 16556 W Apache Dr
- 16146 W Oak Ave
- 17040 Cheyenne Ct
- 15959 Prairie View Ct Unit T6
- 15949 Prairie View Ct Unit T5
- The Lauren Plan at Prairie Ridge North
- 17457 Teton Cir
- 17457 Teton Cir
- 17455 Teton Cir
- 17459 Teton Cir
- 17453 Teton Cir
- 17461 Teton Cir
- 17456 Teton Cir
- 17454 Teton Cir
- 17458 Teton Cir
- 17452 Teton Cir
- 17451 Teton Cir
- 17463 Teton Cir Unit B
- 17465 Teton Cir
- 17449 Teton Cir
- 17467 Teton Cir
- 17460 Teton Cir
- 17445 Teton Cir
- 17437 Teton Cir Unit C
- 17450 Teton Cir
- 17462 Teton Cir