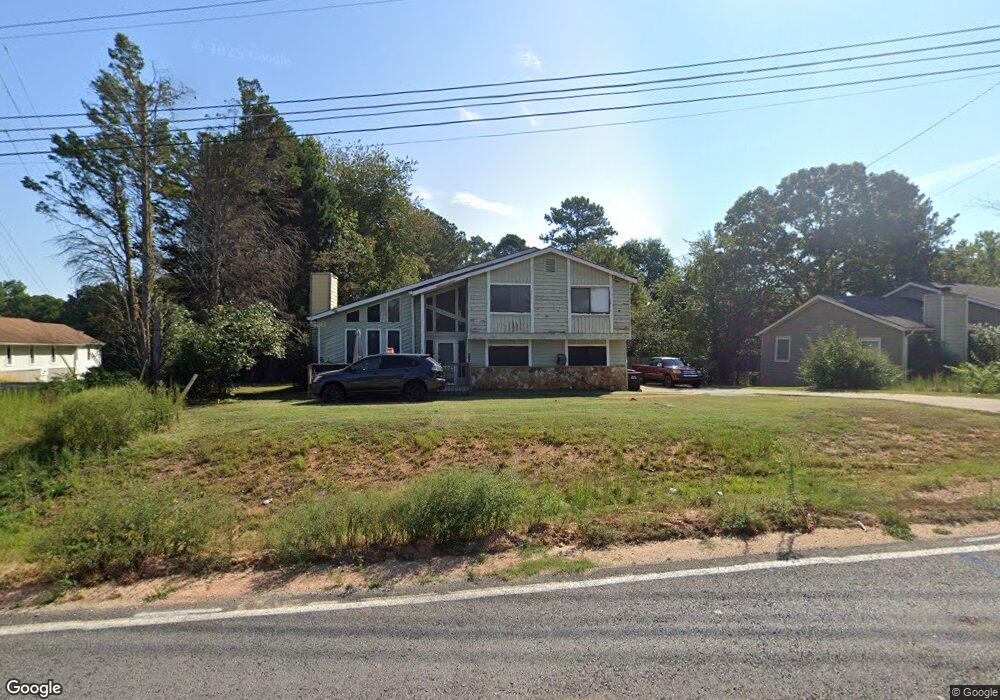
1746 Lee Rd Lithia Springs, GA 30122
Lithia Springs NeighborhoodEstimated Value: $294,701 - $311,000
3
Beds
3
Baths
1,984
Sq Ft
$153/Sq Ft
Est. Value
About This Home
This home is located at 1746 Lee Rd, Lithia Springs, GA 30122 and is currently estimated at $303,425, approximately $152 per square foot. 1746 Lee Rd is a home located in Douglas County with nearby schools including Sweetwater Elementary School, Factory Shoals Middle School, and Lithia Springs Comprehensive High School.
Ownership History
Date
Name
Owned For
Owner Type
Purchase Details
Closed on
Jan 15, 2021
Sold by
Morgan Mark J and Morgan Gretchen G
Bought by
Wheeler Derick H and Wheeler Shauntice
Current Estimated Value
Purchase Details
Closed on
Nov 20, 1998
Sold by
Jones Stephen K
Bought by
Hariston Donald and Wheeler Id
Home Financials for this Owner
Home Financials are based on the most recent Mortgage that was taken out on this home.
Original Mortgage
$110,925
Interest Rate
6.87%
Mortgage Type
New Conventional
Purchase Details
Closed on
Mar 13, 1998
Sold by
Taylor Troy J and Marino Joseph A
Bought by
Jones Stephen K
Home Financials for this Owner
Home Financials are based on the most recent Mortgage that was taken out on this home.
Original Mortgage
$113,900
Interest Rate
7.03%
Mortgage Type
New Conventional
Purchase Details
Closed on
May 20, 1996
Sold by
Fischer Margaret
Bought by
Taylor Troy and Marino Joseph
Create a Home Valuation Report for This Property
The Home Valuation Report is an in-depth analysis detailing your home's value as well as a comparison with similar homes in the area
Home Values in the Area
Average Home Value in this Area
Purchase History
| Date | Buyer | Sale Price | Title Company |
|---|---|---|---|
| Wheeler Derick H | $432,000 | None Listed On Document | |
| Hariston Donald | $130,500 | -- | |
| Jones Stephen K | $119,900 | -- | |
| Taylor Troy | $108,000 | -- |
Source: Public Records
Mortgage History
| Date | Status | Borrower | Loan Amount |
|---|---|---|---|
| Previous Owner | Hariston Donald | $110,925 | |
| Previous Owner | Hariston Donald | $4,600 | |
| Previous Owner | Jones Stephen K | $113,900 | |
| Closed | Taylor Troy | $0 |
Source: Public Records
Tax History Compared to Growth
Tax History
| Year | Tax Paid | Tax Assessment Tax Assessment Total Assessment is a certain percentage of the fair market value that is determined by local assessors to be the total taxable value of land and additions on the property. | Land | Improvement |
|---|---|---|---|---|
| 2024 | $624 | $113,840 | $23,200 | $90,640 |
| 2023 | $624 | $113,840 | $23,200 | $90,640 |
| 2022 | $650 | $80,120 | $16,000 | $64,120 |
| 2021 | $650 | $60,720 | $8,960 | $51,760 |
| 2020 | $650 | $60,720 | $8,960 | $51,760 |
| 2019 | $528 | $59,280 | $8,960 | $50,320 |
| 2018 | $528 | $57,840 | $8,960 | $48,880 |
| 2017 | $491 | $51,600 | $8,960 | $42,640 |
| 2016 | $1,780 | $58,880 | $8,960 | $49,920 |
| 2015 | $1,164 | $38,680 | $6,040 | $32,640 |
| 2014 | $1,284 | $41,560 | $7,040 | $34,520 |
| 2013 | -- | $41,520 | $7,040 | $34,480 |
Source: Public Records
Map
Nearby Homes
- 2182 Ann Ln
- 2436 Falls River Dr
- 1815 Lee Rd
- 1940 Lee
- 2275 Chestnut Log Loop
- 2499 Chestnut Log Loop
- 2322 Chestnut Log Loop
- 8816 Sibella Ct
- 1774 Trail Creek Dr
- 3570 Briar Dr
- 1535 Olde Oak Dr
- 2087 Chestnut Way
- 3652 Sweetbriar Cir
- 0 W Lake Vulcan Dr Unit 10587241
- 3686 Sweetbriar Cir
- 3646 Briar Dr
- 3790 Sweetbriar Cir
- LOT 27 Chestnut Ln
- 8684 Hickory Ln
- HAYDEN Plan at Fairhaven
- 2310 Brookstone Dr
- 2300 Brookstone Dr
- 2290 Brookstone Dr
- 2346 Falls River Dr
- 2335 Park Ave
- 2305 Brookstone Dr
- 2315 Brookstone Dr
- 2295 Brookstone Dr
- 2280 Brookstone Dr
- 2345 Park Ave
- 2231 Falls River Dr
- 2285 Brookstone Dr
- 2356 Falls River Dr
- 2270 Brookstone Dr
- 1750 Bailey Ln
- 2355 Park Ave
- 2324 Park Ave
- 2324 Park Ave Unit 59
- 2275 Brookstone Dr Unit 47
- 2275 Brookstone Dr