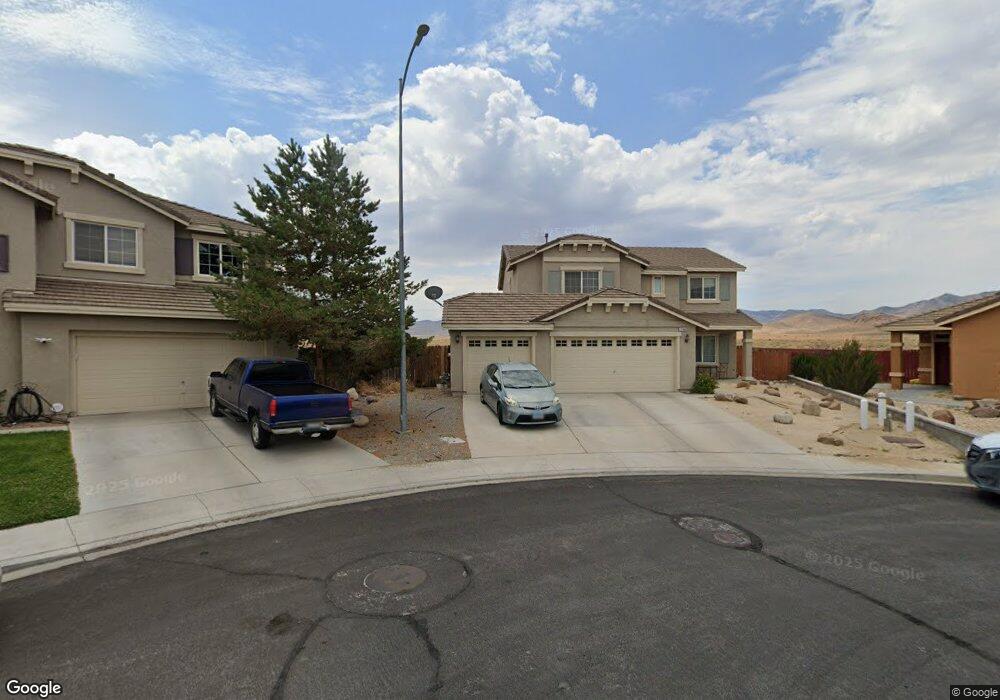
1746 Olive Branch Ct Fernley, NV 89408
Estimated Value: $461,796 - $516,000
4
Beds
3
Baths
2,405
Sq Ft
$200/Sq Ft
Est. Value
About This Home
This home is located at 1746 Olive Branch Ct, Fernley, NV 89408 and is currently estimated at $481,199, approximately $200 per square foot. 1746 Olive Branch Ct is a home located in Lyon County with nearby schools including Fernley Elementary School, Fernley Intermediate School, and Fernley High School.
Ownership History
Date
Name
Owned For
Owner Type
Purchase Details
Closed on
Dec 2, 2022
Sold by
Gerdt Yelena A
Bought by
Serenko Thomas J
Current Estimated Value
Purchase Details
Closed on
Nov 17, 2006
Sold by
R & K Homes Royal Oaks Llc
Bought by
Serenko Thomas J and Gerdt Yelena A
Home Financials for this Owner
Home Financials are based on the most recent Mortgage that was taken out on this home.
Original Mortgage
$228,800
Interest Rate
6.37%
Mortgage Type
Purchase Money Mortgage
Create a Home Valuation Report for This Property
The Home Valuation Report is an in-depth analysis detailing your home's value as well as a comparison with similar homes in the area
Home Values in the Area
Average Home Value in this Area
Purchase History
| Date | Buyer | Sale Price | Title Company |
|---|---|---|---|
| Serenko Thomas J | -- | -- | |
| Serenko Thomas J | $286,000 | Stewart Title Company |
Source: Public Records
Mortgage History
| Date | Status | Borrower | Loan Amount |
|---|---|---|---|
| Previous Owner | Serenko Thomas J | $228,800 |
Source: Public Records
Tax History Compared to Growth
Tax History
| Year | Tax Paid | Tax Assessment Tax Assessment Total Assessment is a certain percentage of the fair market value that is determined by local assessors to be the total taxable value of land and additions on the property. | Land | Improvement |
|---|---|---|---|---|
| 2025 | $2,492 | $138,134 | $47,250 | $90,884 |
| 2024 | $2,717 | $138,717 | $47,250 | $91,466 |
| 2023 | $2,717 | $132,921 | $47,250 | $85,671 |
| 2022 | $2,354 | $126,242 | $47,250 | $78,992 |
| 2021 | $2,322 | $108,417 | $31,500 | $76,917 |
| 2020 | $2,262 | $104,892 | $31,500 | $73,392 |
| 2019 | $2,224 | $102,374 | $31,500 | $70,874 |
| 2018 | $2,175 | $97,024 | $28,000 | $69,024 |
| 2017 | $2,157 | $85,756 | $16,800 | $68,956 |
| 2016 | $1,957 | $65,985 | $6,300 | $59,685 |
| 2015 | $1,991 | $50,734 | $6,300 | $44,434 |
| 2014 | $1,944 | $46,915 | $6,300 | $40,615 |
Source: Public Records
Map
Nearby Homes
- 1720 Blue Oak Ct
- 1715 Short Oak Ct
- 242 Red Oak Dr
- 234 Red Oak Dr
- 227 Red Oak Dr
- 180 Walnut Dr
- 610 Desert Shadows Ln
- 1453 Grey Bluffs Dr
- 1394 Red Bluff Way Unit 1
- 113-123 Sario Dr
- 910 Desert Shadows Ln
- 13 Valley View Dr
- 21 Valley View Dr
- 6405 Highway 95a Unit 247
- 8350 Highway 95a
- 3690 Highway 95a
- 3670 Highway 95a
- 5460 Highway 95a
- 3565 Highway 95a
- 3985 Highway 95a
- 1746 Olive Branch Rd
- 1744 Olive Branch Ct
- 1744 Olive Branch Rd
- 1747 Olive Branch Ct
- 1747 Olive Branch Rd
- 1742 Olive Branch Rd
- 1745 Olive Branch Rd
- 1745 Olive Branch Ct
- 1743 Olive Branch Rd
- 1743 Olive Branch Ct
- 1740 Olive Branch Ct
- 1740 Olive Branch Rd Unit 3
- 1741 Olive Branch Rd
- 1741 Olive Branch Ct
- 1726 Oak Dr
- 1738 Olive Branch Ct
- 1738 Olive Branch Rd Unit 3
- 161 Hazelnut Dr Unit 3
- 1724 Oak Dr
- 1739 Olive Branch Ct