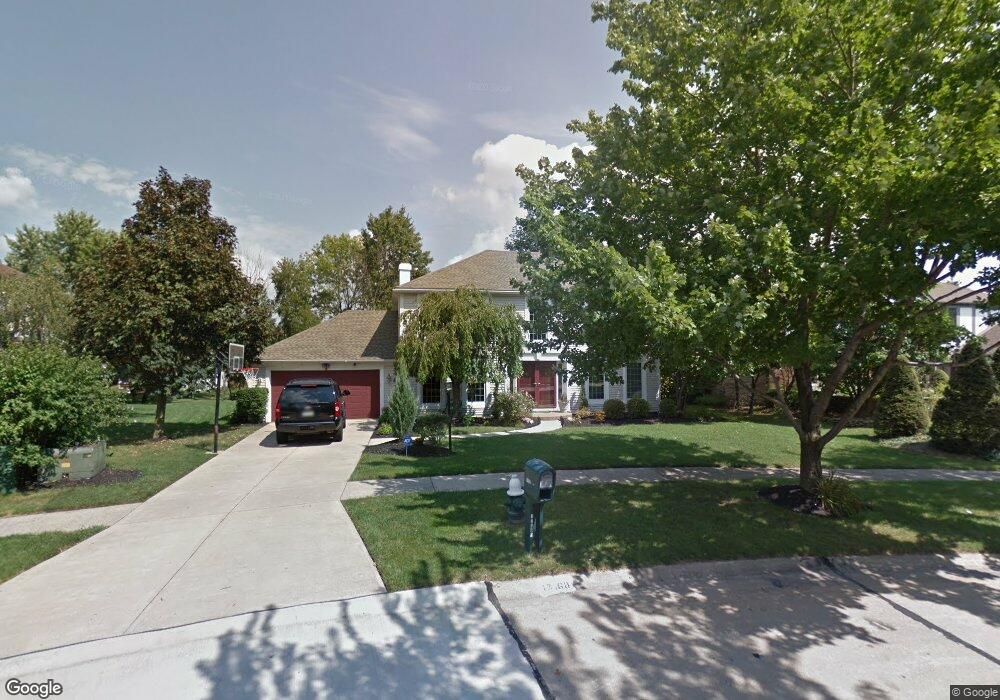
17468 Olde Surrey Ct Strongsville, OH 44136
Estimated Value: $383,379 - $443,000
4
Beds
3
Baths
2,374
Sq Ft
$174/Sq Ft
Est. Value
About This Home
This home is located at 17468 Olde Surrey Ct, Strongsville, OH 44136 and is currently estimated at $412,345, approximately $173 per square foot. 17468 Olde Surrey Ct is a home located in Cuyahoga County with nearby schools including Strongsville High School and Saint Ambrose Catholic School.
Ownership History
Date
Name
Owned For
Owner Type
Purchase Details
Closed on
Nov 19, 2010
Sold by
Estate Of Moussa Saiti
Bought by
Salti Inas
Current Estimated Value
Purchase Details
Closed on
Sep 25, 2001
Sold by
Tucker Brian D and Tucker Janet Marie
Bought by
Salti Moussa F
Home Financials for this Owner
Home Financials are based on the most recent Mortgage that was taken out on this home.
Original Mortgage
$181,600
Interest Rate
6.97%
Purchase Details
Closed on
Feb 8, 1993
Sold by
Britto John D and Britto Charlotte
Bought by
Tucker Brian D
Purchase Details
Closed on
Aug 3, 1983
Sold by
Ballard Douglas L
Bought by
Britto John D and Britto Charlotte
Purchase Details
Closed on
Jan 23, 1981
Bought by
Ballard Douglas L
Purchase Details
Closed on
Jan 4, 1980
Bought by
Parkview Corp
Purchase Details
Closed on
Jan 1, 1978
Bought by
Casa Dev Co
Create a Home Valuation Report for This Property
The Home Valuation Report is an in-depth analysis detailing your home's value as well as a comparison with similar homes in the area
Home Values in the Area
Average Home Value in this Area
Purchase History
| Date | Buyer | Sale Price | Title Company |
|---|---|---|---|
| Salti Inas | -- | None Available | |
| Salti Moussa F | $227,000 | Rockwell Title Agency Inc | |
| Tucker Brian D | $154,000 | -- | |
| Britto John D | $98,000 | -- | |
| Ballard Douglas L | $112,400 | -- | |
| Parkview Corp | -- | -- | |
| Casa Dev Co | -- | -- |
Source: Public Records
Mortgage History
| Date | Status | Borrower | Loan Amount |
|---|---|---|---|
| Previous Owner | Salti Moussa F | $181,600 |
Source: Public Records
Tax History Compared to Growth
Tax History
| Year | Tax Paid | Tax Assessment Tax Assessment Total Assessment is a certain percentage of the fair market value that is determined by local assessors to be the total taxable value of land and additions on the property. | Land | Improvement |
|---|---|---|---|---|
| 2024 | $5,875 | $122,220 | $24,010 | $98,210 |
| 2023 | $5,591 | $87,400 | $20,760 | $66,640 |
| 2022 | $5,551 | $87,400 | $20,760 | $66,640 |
| 2021 | $5,512 | $87,400 | $20,760 | $66,640 |
| 2020 | $5,464 | $76,650 | $18,200 | $58,450 |
| 2019 | $5,307 | $219,000 | $52,000 | $167,000 |
| 2018 | $2,414 | $76,650 | $18,200 | $58,450 |
| 2017 | $5,002 | $73,510 | $14,880 | $58,630 |
| 2016 | $4,962 | $73,510 | $14,880 | $58,630 |
| 2015 | $5,033 | $73,510 | $14,880 | $58,630 |
| 2014 | $5,033 | $73,510 | $14,880 | $58,630 |
Source: Public Records
Map
Nearby Homes
- 18411 Yorktown Oval
- 16711 Beech Cir
- 17682 Drake Rd
- 17934 Cambridge Oval
- 16486 S Red Rock Dr
- 17159 Turkey Meadow Ln
- 17024 Bear Creek Ln
- 18294 Drake Rd
- 17130 Golden Star Dr
- 18848 Pearl Rd
- 18229 Howe Rd
- 3550 Boston Rd
- 16650 Lanier Ave
- 97 Weathervane Ln
- 15604-REAR Boston Rd
- 196 Pinnacle Dr
- 19694 Benbow Rd
- 17259 Woodshire Dr
- 19740 Benbow Rd
- 17069 Partridge Dr
- 17450 Olde Surrey Ct
- 17486 Olde Surrey Ct
- 17439 Lexington Ln
- 17393 Lexington Ln
- 17467 Lexington Ln
- 17505 Olde Surrey Ct
- 17432 Olde Surrey Ct
- 17504 Olde Surrey Ct
- 17375 Lexington Ln
- 17433 Olde Surrey Ct
- 18425 Saratoga Trail
- 18453 Saratoga Trail
- 17414 Olde Surrey Ct
- 17347 Lexington Ln
- 18411 Saratoga Trail
- 17503 Lexington Ln
- 18481 Saratoga Trail
- 18397 Saratoga Trail
- 17408 Lexington Ln
- 17430 Lexington Ln