17471 Mountain View Rd SE Monroe, WA 98272
Estimated Value: $622,000 - $701,000
4
Beds
3
Baths
1,758
Sq Ft
$372/Sq Ft
Est. Value
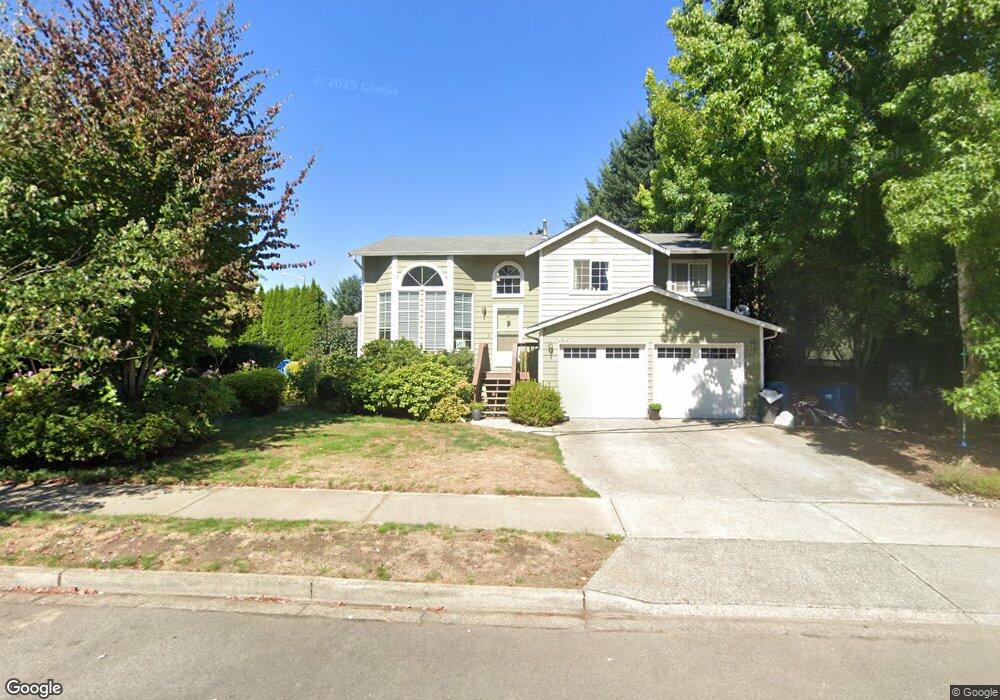
About This Home
This home is located at 17471 Mountain View Rd SE, Monroe, WA 98272 and is currently estimated at $653,937, approximately $371 per square foot. 17471 Mountain View Rd SE is a home located in Snohomish County with nearby schools including Fryelands Elementary School, Monroe High School, and Monroe Christian School.
Ownership History
Date
Name
Owned For
Owner Type
Purchase Details
Closed on
Jun 17, 2009
Sold by
Mcdanold Travis and Mcdanold Elizabeth
Bought by
Cameron David and Cameron Johanna
Current Estimated Value
Home Financials for this Owner
Home Financials are based on the most recent Mortgage that was taken out on this home.
Original Mortgage
$250,025
Outstanding Balance
$158,480
Interest Rate
4.83%
Mortgage Type
FHA
Estimated Equity
$495,457
Purchase Details
Closed on
Jun 21, 2002
Sold by
Parkinson John Jay
Bought by
Mcdanold Travis and Mcdanold Elizabeth
Home Financials for this Owner
Home Financials are based on the most recent Mortgage that was taken out on this home.
Original Mortgage
$194,940
Interest Rate
6.86%
Mortgage Type
FHA
Purchase Details
Closed on
Dec 9, 1997
Sold by
Himalaya Homes Inc
Bought by
Parkinson John Jay
Home Financials for this Owner
Home Financials are based on the most recent Mortgage that was taken out on this home.
Original Mortgage
$142,450
Interest Rate
7.23%
Mortgage Type
Balloon
Create a Home Valuation Report for This Property
The Home Valuation Report is an in-depth analysis detailing your home's value as well as a comparison with similar homes in the area
Home Values in the Area
Average Home Value in this Area
Purchase History
| Date | Buyer | Sale Price | Title Company |
|---|---|---|---|
| Cameron David | $265,000 | Chicago Title | |
| Mcdanold Travis | $198,000 | -- | |
| Parkinson John Jay | $149,950 | -- |
Source: Public Records
Mortgage History
| Date | Status | Borrower | Loan Amount |
|---|---|---|---|
| Open | Cameron David | $250,025 | |
| Previous Owner | Mcdanold Travis | $194,940 | |
| Previous Owner | Parkinson John Jay | $142,450 |
Source: Public Records
Tax History Compared to Growth
Tax History
| Year | Tax Paid | Tax Assessment Tax Assessment Total Assessment is a certain percentage of the fair market value that is determined by local assessors to be the total taxable value of land and additions on the property. | Land | Improvement |
|---|---|---|---|---|
| 2025 | $4,322 | $560,200 | $291,700 | $268,500 |
| 2024 | $4,322 | $533,800 | $277,400 | $256,400 |
| 2023 | $4,312 | $577,700 | $312,300 | $265,400 |
| 2022 | $3,931 | $420,200 | $207,600 | $212,600 |
| 2020 | $3,586 | $369,400 | $183,300 | $186,100 |
| 2019 | $3,395 | $345,200 | $173,600 | $171,600 |
| 2018 | $3,650 | $304,200 | $141,600 | $162,600 |
| 2017 | $3,162 | $275,700 | $124,200 | $151,500 |
| 2016 | $3,178 | $255,000 | $98,700 | $156,300 |
| 2015 | $2,991 | $225,800 | $84,600 | $141,200 |
| 2013 | $2,625 | $181,200 | $70,500 | $110,700 |
Source: Public Records
Map
Nearby Homes
- 17342 Mountain View Rd SE
- 17284 157th St SE
- 17417 W Main St Unit E101
- 15217 172nd Ave SE
- 17510 W Main St Unit C103
- 16951 Tulip Ln
- 15087 172nd Ave SE
- 16311 177th Ave SE
- 17856 152nd St SE
- 18155 W Columbia St
- 1152 Johnson St SE
- 15027 179th Ave SE
- 16096 Roma Dr SE
- 15327 182nd Ave SE
- 17795 149th St SE Unit 9
- 17815 149th St SE Unit 14
- 17803 149th St SE Unit 11
- 16855 Wales St SE
- 15648 Lakeview Ave SE
- 1017 W Main St Unit B101
- 17437 156th St SE
- 17497 Mountain View Rd SE
- 17474 Mountain View Rd SE
- 17423 156th St SE
- 17460 Mountain View Rd SE
- 17435 Mountain View Rd SE
- 17492 Mountain View Rd SE
- 17442 Mountain View Rd SE
- 17515 Mountain View Rd SE
- 17407 156th St SE
- 17510 Mountain View Rd SE
- 17426 Mountain View Rd SE
- 17533 Mountain View Rd SE
- 17384 156th St SE
- 17528 Mountain View Rd SE
- 17387 156th St SE
- 17551 Mountain View Rd SE
- 15569 174th Ave SE
- 15583 174th Ave SE
- 17358 156th St SE