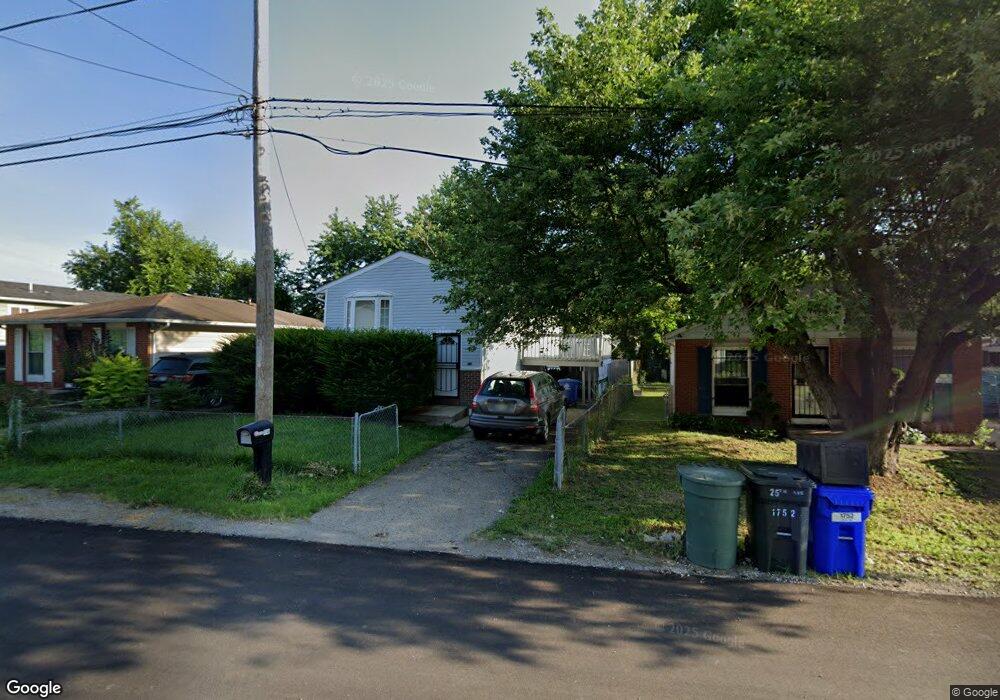
1748 E 25th Ave Columbus, OH 43219
Argyle Park NeighborhoodEstimated Value: $118,000 - $196,000
3
Beds
3
Baths
1,347
Sq Ft
$114/Sq Ft
Est. Value
About This Home
This home is located at 1748 E 25th Ave, Columbus, OH 43219 and is currently estimated at $154,067, approximately $114 per square foot. 1748 E 25th Ave is a home located in Franklin County with nearby schools including South Mifflin Stem Academy (K-6), Linden-Mckinley Stem School On Arcadia, and North Columbus Preparatory Academy.
Ownership History
Date
Name
Owned For
Owner Type
Purchase Details
Closed on
Apr 4, 2008
Sold by
Aurora Loan Services Llc
Bought by
Flores Eridian R
Current Estimated Value
Purchase Details
Closed on
Feb 28, 2008
Sold by
The Cit Group/Consumer Finance Inc
Bought by
Aurora Loan Services Llc
Purchase Details
Closed on
Dec 17, 2007
Sold by
Talbert Krisstina E
Bought by
The Cit Group/Consumer Finance Inc
Purchase Details
Closed on
Apr 28, 2004
Sold by
Estate Of Rosie Lee Shouse
Bought by
Talbert Krisstina E
Purchase Details
Closed on
Aug 26, 1971
Bought by
Duckett Rosie L
Create a Home Valuation Report for This Property
The Home Valuation Report is an in-depth analysis detailing your home's value as well as a comparison with similar homes in the area
Home Values in the Area
Average Home Value in this Area
Purchase History
| Date | Buyer | Sale Price | Title Company |
|---|---|---|---|
| Flores Eridian R | $20,000 | Land Castl | |
| Aurora Loan Services Llc | -- | Land Castl | |
| The Cit Group/Consumer Finance Inc | $36,000 | Land Castl | |
| Talbert Krisstina E | -- | -- | |
| Duckett Rosie L | -- | -- |
Source: Public Records
Tax History
| Year | Tax Paid | Tax Assessment Tax Assessment Total Assessment is a certain percentage of the fair market value that is determined by local assessors to be the total taxable value of land and additions on the property. | Land | Improvement |
|---|---|---|---|---|
| 2025 | $1,739 | $38,750 | $3,680 | $35,070 |
| 2024 | $1,739 | $38,750 | $3,680 | $35,070 |
| 2023 | $1,717 | $38,750 | $3,680 | $35,070 |
| 2022 | $826 | $15,930 | $2,450 | $13,480 |
| 2021 | $828 | $15,930 | $2,450 | $13,480 |
| 2020 | $829 | $15,930 | $2,450 | $13,480 |
| 2019 | $795 | $13,100 | $2,070 | $11,030 |
| 2018 | $793 | $13,100 | $2,070 | $11,030 |
| 2017 | $794 | $13,100 | $2,070 | $11,030 |
| 2016 | $874 | $13,200 | $2,280 | $10,920 |
| 2015 | $794 | $13,200 | $2,280 | $10,920 |
| 2014 | $796 | $13,200 | $2,280 | $10,920 |
| 2013 | $436 | $14,665 | $2,520 | $12,145 |
Source: Public Records
Map
Nearby Homes
- 1810 E 26th Ave
- 1805 E 26th Ave
- 1684 E Blake Ave
- 1554 E Maynard Ave
- 2080 Parkwood Ave Unit 2090
- 2020 Berrell Ave
- 1564-1566 E Blake Ave
- 1625 Kenmore Rd
- 1991 Woodland Ave
- 1608 Kenmore Rd
- 2126 Cleveland Ave
- 0 Rankin Ave Unit (Rear)
- 1864 E Hudson St
- 1893 Jermain Dr
- 2163 Cleveland Ave Unit 2161
- 0 E Maynard Ave
- 1386 E 22nd Ave
- 1437 E 19th Ave
- 1457 Cordell Ave
- 0 Parkwood Ave
- 1752 E 25th Ave
- 1742 E 25th Ave
- 1760 E 25th Ave
- 1732 E 25th Ave
- 1766 E 25th Ave
- 1745 E 26th Ave
- 1728 E 25th Ave
- 1759 E 26th Ave
- 1772 E 25th Ave
- 1737 E 26th Ave
- 1765 E 26th Ave
- 1747 E 25th Ave
- 1741 E 25th Ave
- 1753 E 25th Ave
- 1173 E 25th Ave
- 1731 E 26th Ave
- 1723 E 25th Ave
- 1716 E 25th Ave
- 1721 E 25th Ave
- 1784 E 25th Ave
Your Personal Tour Guide
Ask me questions while you tour the home.