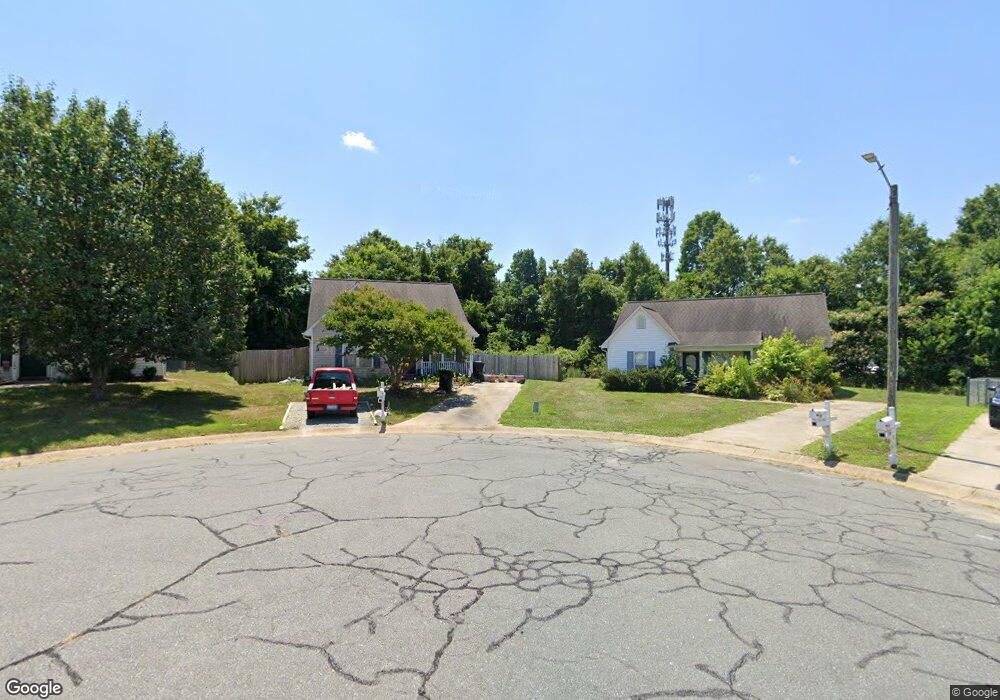
1748 Farningham Ln Burlington, NC 27215
East Burlington NeighborhoodEstimated Value: $214,000 - $255,000
3
Beds
2
Baths
1,251
Sq Ft
$194/Sq Ft
Est. Value
About This Home
This home is located at 1748 Farningham Ln, Burlington, NC 27215 and is currently estimated at $242,605, approximately $193 per square foot. 1748 Farningham Ln is a home located in Alamance County with nearby schools including Harvey R. Newlin Elementary School, Graham Middle School, and Graham High School.
Ownership History
Date
Name
Owned For
Owner Type
Purchase Details
Closed on
Jun 24, 2011
Sold by
Holmes Ronald Jarrod
Bought by
Mital Jeffrey D
Current Estimated Value
Home Financials for this Owner
Home Financials are based on the most recent Mortgage that was taken out on this home.
Original Mortgage
$111,012
Outstanding Balance
$75,589
Interest Rate
4.37%
Mortgage Type
FHA
Estimated Equity
$167,016
Purchase Details
Closed on
May 25, 2007
Sold by
Carter Ricky B
Bought by
Holmes Ronald J
Home Financials for this Owner
Home Financials are based on the most recent Mortgage that was taken out on this home.
Original Mortgage
$120,000
Interest Rate
6.17%
Mortgage Type
New Conventional
Purchase Details
Closed on
Mar 28, 2002
Sold by
Concept Bldrs Inc
Bought by
Carter Ricky B
Home Financials for this Owner
Home Financials are based on the most recent Mortgage that was taken out on this home.
Original Mortgage
$112,309
Interest Rate
6.85%
Mortgage Type
FHA
Create a Home Valuation Report for This Property
The Home Valuation Report is an in-depth analysis detailing your home's value as well as a comparison with similar homes in the area
Home Values in the Area
Average Home Value in this Area
Purchase History
| Date | Buyer | Sale Price | Title Company |
|---|---|---|---|
| Mital Jeffrey D | $114,000 | -- | |
| Holmes Ronald J | $120,000 | -- | |
| Carter Ricky B | $114,500 | -- |
Source: Public Records
Mortgage History
| Date | Status | Borrower | Loan Amount |
|---|---|---|---|
| Open | Mital Jeffrey D | $111,012 | |
| Previous Owner | Holmes Ronald J | $120,000 | |
| Previous Owner | Carter Ricky B | $112,309 |
Source: Public Records
Tax History
| Year | Tax Paid | Tax Assessment Tax Assessment Total Assessment is a certain percentage of the fair market value that is determined by local assessors to be the total taxable value of land and additions on the property. | Land | Improvement |
|---|---|---|---|---|
| 2025 | $1,157 | $234,183 | $22,000 | $212,183 |
| 2024 | $1,098 | $234,183 | $22,000 | $212,183 |
| 2023 | $2,133 | $234,183 | $22,000 | $212,183 |
| 2022 | $1,398 | $112,626 | $20,000 | $92,626 |
| 2021 | $1,409 | $112,626 | $20,000 | $92,626 |
| 2020 | $1,420 | $112,626 | $20,000 | $92,626 |
| 2019 | $1,424 | $112,626 | $20,000 | $92,626 |
| 2018 | $669 | $112,626 | $20,000 | $92,626 |
| 2017 | $1,326 | $112,626 | $20,000 | $92,626 |
| 2016 | $1,353 | $116,654 | $20,000 | $96,654 |
| 2015 | $673 | $116,654 | $20,000 | $96,654 |
| 2014 | $615 | $116,654 | $20,000 | $96,654 |
Source: Public Records
Map
Nearby Homes
- 719 Arden St
- 1234 Kenwood Dr
- 825 Parkwood St
- 2129 Wrenn St
- 915 Turrentine St
- 719 Center Ave
- 735 Everett St
- 1932 Wood Ave
- 1215 Cleveland Ave
- 1304 Queen Ann St
- 1214 Queen Ann St
- 1917 Tucker St
- 608 Oak St
- 1302 Sidney Ave
- 1217 Border St
- 524 Avon Ave
- 516 Avon Ave
- 0 Lewis Dr
- 511 Cameron St
- 1945 Hilldale Dr
- 1744 Farningham Ln
- 1752 Farningham Ln
- 1740 Farningham Ln
- 1749 Farningham Ln
- 1734 Farningham Ln
- 1741 Farningham Ln
- 1745 Farningham Ln
- 1733 Farningham Ln
- 1728 Farningham Ln
- 1727 Farningham Ln
- 1722 Farningham Ln
- 1723 Bradford Ct
- 1728 Bradford Ct
- 1721 Farningham Ln
- 1718 Farningham Ln
- 1719 Bradford Ct
- 1717 Farningham Ln
- 1724 Bradford Ct
- 534 Arden St
- 1721 Maple Ave
Your Personal Tour Guide
Ask me questions while you tour the home.