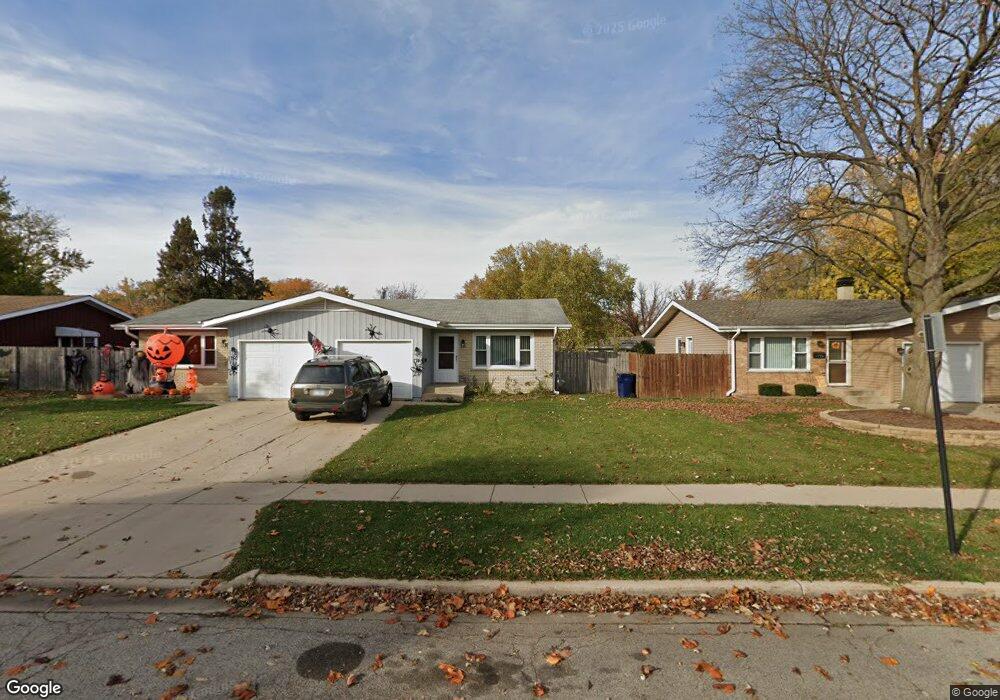
1748 Maple Ln Unit 50 Elgin, IL 60123
North Country Knolls NeighborhoodEstimated Value: $305,078 - $361,000
Studio
--
Bath
1,525
Sq Ft
$225/Sq Ft
Est. Value
About This Home
This home is located at 1748 Maple Ln Unit 50, Elgin, IL 60123 and is currently estimated at $343,020, approximately $224 per square foot. 1748 Maple Ln Unit 50 is a home located in Kane County with nearby schools including Hillcrest Elementary School, Kimball Middle School, and Larkin High School.
Ownership History
Date
Name
Owned For
Owner Type
Purchase Details
Closed on
Mar 2, 2026
Sold by
Warren Michael and Warren Laurel A
Bought by
Michael G Warren Declaration Of Trust and Warren
Current Estimated Value
Purchase Details
Closed on
Jun 8, 2005
Sold by
Petersen Billy A and Woolf Joy B
Bought by
Warren Michael E and Warren Laurel A
Home Financials for this Owner
Home Financials are based on the most recent Mortgage that was taken out on this home.
Original Mortgage
$204,000
Interest Rate
5.77%
Mortgage Type
Fannie Mae Freddie Mac
Purchase Details
Closed on
Jun 28, 2002
Sold by
Gaona Jose A and Willis Janis A
Bought by
Woolf Joy B and Petersen Billy A
Home Financials for this Owner
Home Financials are based on the most recent Mortgage that was taken out on this home.
Original Mortgage
$200,150
Interest Rate
6.79%
Mortgage Type
FHA
Purchase Details
Closed on
Sep 30, 1998
Sold by
Nelson Robert E and Nelson Martha J
Bought by
Gaona Jose A and Willis Janis A
Home Financials for this Owner
Home Financials are based on the most recent Mortgage that was taken out on this home.
Original Mortgage
$149,150
Interest Rate
6.5%
Create a Home Valuation Report for This Property
The Home Valuation Report is an in-depth analysis detailing your home's value as well as a comparison with similar homes in the area
Home Values in the Area
Average Home Value in this Area
Purchase History
| Date | Buyer | Sale Price | Title Company |
|---|---|---|---|
| Michael G Warren Declaration Of Trust | -- | None Listed On Document | |
| Warren Michael E | $240,000 | First American Title Ins Co | |
| Woolf Joy B | $203,000 | Chicago Title Insurance Co | |
| Gaona Jose A | $157,000 | -- |
Source: Public Records
Mortgage History
| Date | Status | Borrower | Loan Amount |
|---|---|---|---|
| Previous Owner | Warren Michael E | $204,000 | |
| Previous Owner | Woolf Joy B | $200,150 | |
| Previous Owner | Gaona Jose A | $149,150 |
Source: Public Records
Tax History
| Year | Tax Paid | Tax Assessment Tax Assessment Total Assessment is a certain percentage of the fair market value that is determined by local assessors to be the total taxable value of land and additions on the property. | Land | Improvement |
|---|---|---|---|---|
| 2024 | $6,861 | $85,734 | $25,795 | $59,939 |
| 2023 | $6,603 | $77,454 | $23,304 | $54,150 |
| 2022 | $6,124 | $70,624 | $21,249 | $49,375 |
| 2021 | $5,891 | $66,028 | $19,866 | $46,162 |
| 2020 | $5,749 | $63,034 | $18,965 | $44,069 |
| 2019 | $5,608 | $60,043 | $18,065 | $41,978 |
| 2018 | $5,592 | $56,564 | $17,018 | $39,546 |
| 2017 | $5,500 | $53,473 | $16,088 | $37,385 |
| 2016 | $5,291 | $49,608 | $14,925 | $34,683 |
| 2015 | -- | $45,470 | $13,680 | $31,790 |
| 2014 | -- | $44,909 | $13,511 | $31,398 |
| 2013 | -- | $46,093 | $13,867 | $32,226 |
Source: Public Records
Map
Nearby Homes
- 1849 Larkin Ave
- 136 Mckinstry Dr
- 1840 W Highland Ave Unit E-105
- 221 Heine Ave
- 2022 Torino Dr
- 356 N Airlite St Unit 356
- 2205 Country Knoll Ln
- 512 Shenandoah Trail
- 1455 Erie St
- 308 N Clifton Ave
- 527 N Lyle Ave
- 530 Cumberland Trail
- 70 S Weston Ave
- 532 Shenandoah Trail
- 10N836 Maple St
- 1059 Larkin Ave
- 262 S Weston Ave
- 10N827 Hawthorne St
- 1017 W Highland Ave
- 1419 Harlan Ave
- 1734 Maple Ln Unit 36
- 1736 Maple Ln
- 1764 Maple Ln Unit 66
- 1735 Lin Lor Ln
- 1718 Maple Ln
- 1755 Lin Lor Ln
- 1715 Lin Lor Ln
- 1780 Maple Ln Unit 82
- 1716 Maple Ln
- 1775 Lin Lor Ln
- 1755 Maple Ln
- 1739 Maple Ln
- 1707 Lin Lor Ln
- 85 N Lyle Ave
- 85 N Lyle Ave Unit 1
- 85 N Lyle Ave Unit 5
- 1795 Lin Lor Ln
- 1710 Maple Ln Unit 12
- 93 N Lyle Ave Unit 8
- 1723 Maple Ln
Your Personal Tour Guide
Ask me questions while you tour the home.