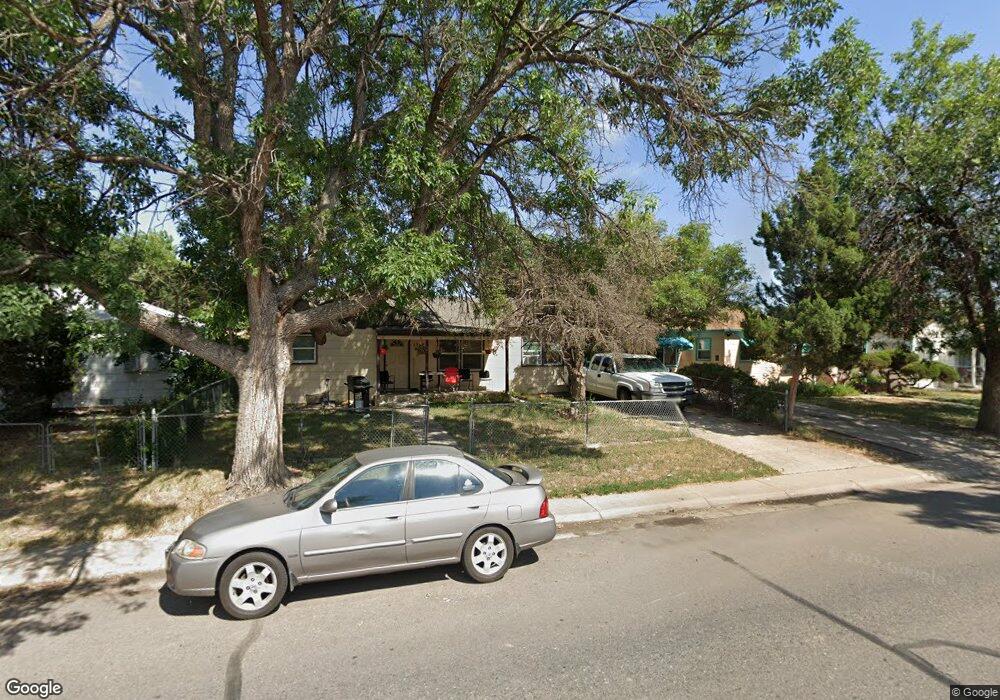
1748 Moline St Aurora, CO 80010
North Aurora NeighborhoodEstimated Value: $329,000 - $418,000
About This Home
This home is located at 1748 Moline St, Aurora, CO 80010 and is currently estimated at $365,834, approximately $398 per square foot. 1748 Moline St is a home located in Adams County with nearby schools including Montview Elementary School, North Middle School Health Sciences & Technology, and Aurora Central High School.
Ownership History
We collect this data history from publicly available records. To have your information removed, we recommend requesting removal directly through your county’s website.
Purchase Details
Purchase Details
Home Financials for this Owner
Home Financials are based on the most recent Mortgage that was taken out on this home.Purchase Details
Home Financials for this Owner
Home Financials are based on the most recent Mortgage that was taken out on this home.Home Values in the Area
Average Home Value in this Area
Purchase History
We collect this data history from publicly available records. To have your information removed, we recommend requesting removal directly through your county’s website.
| Date | Buyer | Sale Price | Title Company |
|---|---|---|---|
| -- | None Available | ||
| $130,000 | North American Title Co | ||
| $114,000 | Land Title Guarantee Company |
Mortgage History
We collect this data history from publicly available records. To have your information removed, we recommend requesting removal directly through your county’s website.
| Date | Status | Borrower | Loan Amount |
|---|---|---|---|
| Previous Owner | $129,136 | ||
| Previous Owner | $102,600 |
Tax History
We collect this data history from publicly available records. To have your information removed, we recommend requesting removal directly through your county’s website.
| Year | Tax Paid | Tax Assessment Tax Assessment Total Assessment is a certain percentage of the fair market value that is determined by local assessors to be the total taxable value of land and additions on the property. | Land | Improvement |
|---|---|---|---|---|
| 2025 | $2,263 | $23,530 | $5,440 | $18,090 |
| 2024 | $2,263 | $21,630 | $5,000 | $16,630 |
| 2023 | $2,299 | $25,300 | $5,210 | $20,090 |
| 2022 | $2,117 | $18,630 | $5,350 | $13,280 |
| 2021 | $2,206 | $18,630 | $5,350 | $13,280 |
| 2020 | $2,291 | $19,410 | $5,510 | $13,900 |
| 2019 | $2,286 | $19,410 | $5,510 | $13,900 |
| 2018 | $1,594 | $13,470 | $4,320 | $9,150 |
| 2017 | $1,761 | $13,470 | $4,320 | $9,150 |
| 2016 | $1,156 | $10,910 | $2,390 | $8,520 |
| 2015 | $1,120 | $10,910 | $2,390 | $8,520 |
| 2014 | $894 | $8,570 | $2,390 | $6,180 |
Map
- 1732 Lansing St
- 11801 E 17th Ave
- 1960 Oakland St
- 1671 Oswego St
- 1605 Oakland St
- 1764 Oswego St
- 1741 Kingston St
- 1781 Kingston St
- 1657 Kingston St
- 11087 Montview Blvd
- 1775 Kenton St
- 2201 Oakland St
- 2216 Lima St
- 2077 Kingston St
- 1455 Lima St
- 1435 Lima St
- 1401 Lima St
- 1729 Jamaica St
- 1372 Lima St
- 2331 Moline St
Ask me questions while you tour the home.