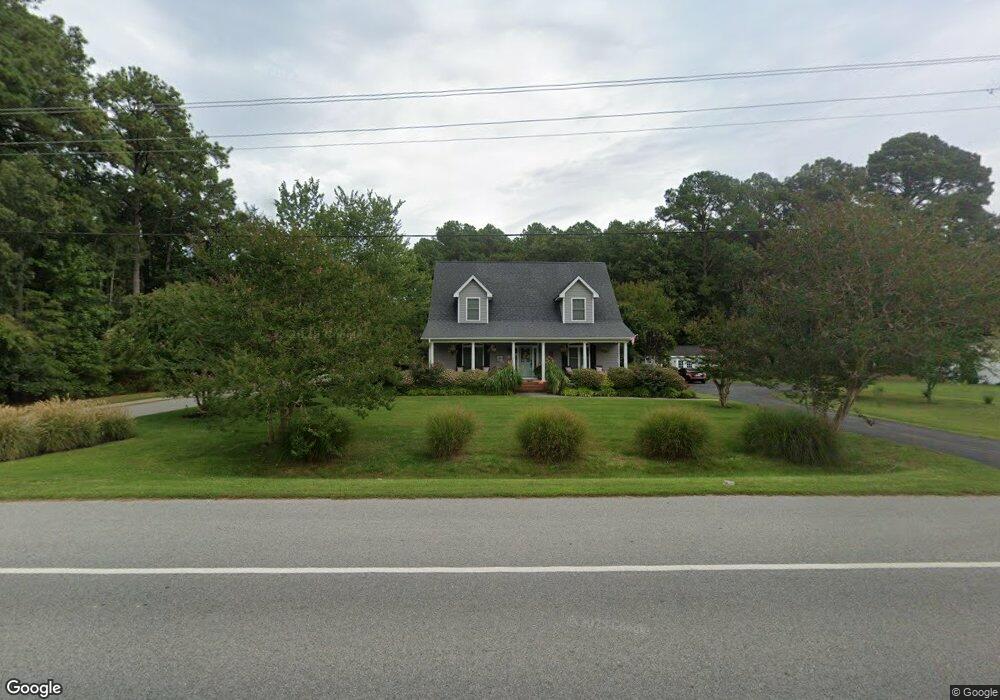
17486 Piney Point Rd Piney Point, MD 20674
Piney Point NeighborhoodEstimated Value: $290,000
2
Beds
1
Bath
936
Sq Ft
$310/Sq Ft
Est. Value
About This Home
This home is located at 17486 Piney Point Rd, Piney Point, MD 20674 and is currently priced at $290,000, approximately $309 per square foot. 17486 Piney Point Rd is a home located in St. Mary's County with nearby schools including Piney Point Elementary School, Spring Ridge Middle School, and Leonardtown High School.
Ownership History
Date
Name
Owned For
Owner Type
Purchase Details
Closed on
Sep 25, 2024
Sold by
Yoho Stephanie and Yoho Morley Stephanie
Bought by
Morley Christopher John and Yoho Morley Stephanie
Current Estimated Value
Purchase Details
Closed on
Sep 24, 2012
Sold by
Garner Rae Wood
Bought by
Cullison John J and Cullison Jacob A
Purchase Details
Closed on
Dec 14, 2007
Sold by
Mundie Tina Tamara
Bought by
Garner Rae Wood
Purchase Details
Closed on
Nov 16, 2007
Sold by
Mundie Tina Tamara
Bought by
Garner Rae Wood
Purchase Details
Closed on
Sep 30, 2004
Sold by
Garner Lawrence Raymond
Bought by
Mundie Tina Tamara and Donovan Joseph Mundie
Purchase Details
Closed on
Aug 13, 2004
Sold by
Garner Lawrence Raymond
Bought by
Garner Lawrence Raymond
Create a Home Valuation Report for This Property
The Home Valuation Report is an in-depth analysis detailing your home's value as well as a comparison with similar homes in the area
Home Values in the Area
Average Home Value in this Area
Purchase History
| Date | Buyer | Sale Price | Title Company |
|---|---|---|---|
| Morley Christopher John | -- | None Listed On Document | |
| Cullison John J | $60,000 | None Available | |
| Garner Rae Wood | -- | -- | |
| Garner Rae Wood | -- | -- | |
| Mundie Tina Tamara | $77,500 | -- | |
| Garner Lawrence Raymond | -- | -- |
Source: Public Records
Mortgage History
| Date | Status | Borrower | Loan Amount |
|---|---|---|---|
| Closed | Mundie Tina Tamara | -- |
Source: Public Records
Tax History
| Year | Tax Paid | Tax Assessment Tax Assessment Total Assessment is a certain percentage of the fair market value that is determined by local assessors to be the total taxable value of land and additions on the property. | Land | Improvement |
|---|---|---|---|---|
| 2025 | $4,002 | $368,800 | $127,000 | $241,800 |
| 2024 | $3,785 | $348,467 | $0 | $0 |
| 2023 | $3,568 | $328,133 | $0 | $0 |
| 2022 | $3,351 | $307,800 | $115,300 | $192,500 |
| 2021 | $3,311 | $304,133 | $0 | $0 |
| 2020 | $3,270 | $300,467 | $0 | $0 |
| 2019 | $3,229 | $296,800 | $104,800 | $192,000 |
| 2018 | $3,155 | $289,967 | $0 | $0 |
| 2017 | $3,005 | $283,133 | $0 | $0 |
| 2016 | -- | $276,300 | $0 | $0 |
| 2015 | -- | $276,300 | $0 | $0 |
| 2014 | $1,779 | $162,900 | $0 | $0 |
Source: Public Records
Map
Nearby Homes
- 17490 Lighthouse Commons Dr
- 45394 Walnut St
- 17262 Larimer St
- 17203 Piney Point Rd
- 17863 2nd St
- 0 Saint Georges Park Rd
- 17615 Driftwood Dr
- 45146 Andover Estates Rd
- 18465 Cherryfield Rd
- Lot 2 Mt Pleasant Fa Drayden Rd
- 18688 Hebb Rd
- Lot 4 Mt Pleasant Fa Drayden Rd
- Lot 6 Mt Pleasant Fa Drayden Rd
- Lot 5 Mt Pleasant Fa Drayden Rd
- 16252 Thomas Rd
- 16386 Ball Point Rd
- 16242 Thomas Rd
- 16129 Piney Point Rd
- 19103 Windsor Ct
- 46234 Stasha Ct
- 17484 Piney Point Rd
- 45306 Daniel Morgan Way
- 43805 Blake Creek Rd
- 17515 Piney Point Rd
- 17485 Piney Point Rd
- 45325 Morgan Point Ln
- 17750 Piney Point Rd
- 17527 Piney Point Rd
- 17476 Piney Point Rd Unit 1
- 17476 Piney Point Rd Unit 11
- 17476 Piney Point Rd Unit 7
- 17476 Piney Point Rd Unit 5
- 17476 Piney Point Rd Unit 10
- 17476 Piney Point Rd Unit 4
- 17476 Piney Point Rd
- 17476 Piney Point Rd Unit 12
- 17476 Piney Point Rd
- 17476 Piney Point Rd Unit 3
- 17476 Piney Point Rd Unit 9
- 17476 Piney Point Rd Unit 8
Your Personal Tour Guide
Ask me questions while you tour the home.