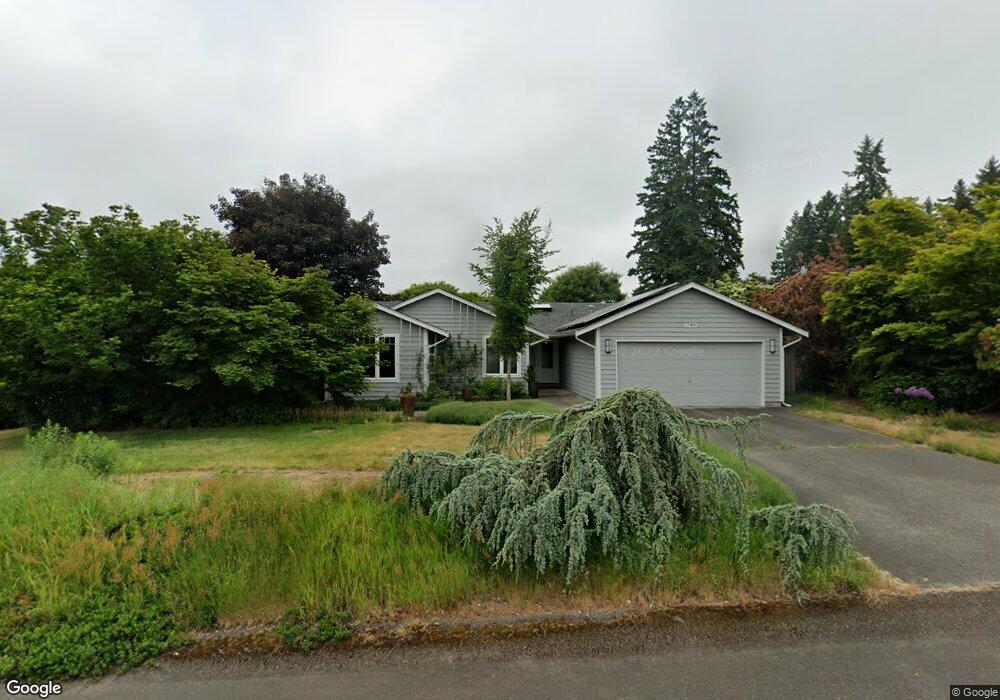
1749 Mapleleaf Ct NE Olympia, WA 98506
Estimated Value: $455,738 - $465,000
3
Beds
2
Baths
1,289
Sq Ft
$357/Sq Ft
Est. Value
About This Home
This home is located at 1749 Mapleleaf Ct NE, Olympia, WA 98506 and is currently estimated at $459,685, approximately $356 per square foot. 1749 Mapleleaf Ct NE is a home located in Thurston County with nearby schools including Pleasant Glade Elementary School, Chinook Middle School, and North Thurston High School.
Ownership History
Date
Name
Owned For
Owner Type
Purchase Details
Closed on
May 29, 2003
Sold by
Newman Dana B and Paris Susan E
Bought by
Scott Kathryn A and Hall Brian C
Current Estimated Value
Home Financials for this Owner
Home Financials are based on the most recent Mortgage that was taken out on this home.
Original Mortgage
$121,600
Outstanding Balance
$53,151
Interest Rate
5.75%
Mortgage Type
Unknown
Estimated Equity
$406,534
Purchase Details
Closed on
Oct 6, 1999
Sold by
Bird Scott A and Bird Tamara L
Bought by
Newman Dana B and Paris Susan E
Home Financials for this Owner
Home Financials are based on the most recent Mortgage that was taken out on this home.
Original Mortgage
$99,900
Interest Rate
7.76%
Purchase Details
Closed on
Apr 13, 1995
Sold by
Sill Susan
Bought by
Bird Scott A and Bird Tamara L
Home Financials for this Owner
Home Financials are based on the most recent Mortgage that was taken out on this home.
Original Mortgage
$102,500
Interest Rate
8.77%
Create a Home Valuation Report for This Property
The Home Valuation Report is an in-depth analysis detailing your home's value as well as a comparison with similar homes in the area
Home Values in the Area
Average Home Value in this Area
Purchase History
| Date | Buyer | Sale Price | Title Company |
|---|---|---|---|
| Scott Kathryn A | $152,000 | Thurston County Title | |
| Newman Dana B | $124,900 | -- | |
| Bird Scott A | $113,900 | Transamerica Title Ins Co |
Source: Public Records
Mortgage History
| Date | Status | Borrower | Loan Amount |
|---|---|---|---|
| Open | Scott Kathryn A | $121,600 | |
| Previous Owner | Newman Dana B | $99,900 | |
| Previous Owner | Bird Scott A | $102,500 |
Source: Public Records
Tax History Compared to Growth
Tax History
| Year | Tax Paid | Tax Assessment Tax Assessment Total Assessment is a certain percentage of the fair market value that is determined by local assessors to be the total taxable value of land and additions on the property. | Land | Improvement |
|---|---|---|---|---|
| 2024 | $3,783 | $376,000 | $148,800 | $227,200 |
| 2023 | $3,783 | $387,800 | $133,300 | $254,500 |
| 2022 | $3,744 | $373,800 | $103,800 | $270,000 |
| 2021 | $3,356 | $310,200 | $88,600 | $221,600 |
| 2020 | $2,968 | $259,900 | $70,400 | $189,500 |
| 2019 | $2,649 | $235,900 | $79,200 | $156,700 |
| 2018 | $2,746 | $197,600 | $51,700 | $145,900 |
| 2017 | $2,338 | $182,000 | $56,200 | $125,800 |
| 2016 | $2,178 | $170,100 | $48,900 | $121,200 |
| 2014 | -- | $171,450 | $48,450 | $123,000 |
Source: Public Records
Map
Nearby Homes
- 1709 Springfield Place NE
- 3701 Mapleview Dr NE
- 3710 Mapleview Dr NE
- 3606 Entrada Dr NE
- 31 xxx Lilly Rd NE
- 3941 16th Ln NE
- 1713 Mike Ct NE
- 2101 Boxcar NE Unit 71
- 3903 Boxcar Ct NE Unit 70
- 3909 Boxcar NE Unit 69
- 3909 Boxcar NE
- 3913 Boxcar Ct NE Unit 68
- 2139 Trailside Dr NE Unit 74
- 2213 Mill St NE
- 3921 Hyde NE
- 2303 Park View St NE
- 3903 Hyde Loop NE Unit 137
- 2321 Trailside NE Unit 83
- 3830 23rd NE Unit 44
- 3834 23rd Ave NE Unit 43
- 1807 Mapleleaf Ct NE
- 1742 Mapleleaf Ct NE
- 3603 Mapleview Dr NE
- 1813 Mapleleaf Ct NE
- 1624 Springfield Ct NE
- 1716 Springfield Place NE
- 1808 Mapleleaf Ct NE
- 3613 Mapleview Dr NE
- 1620 Springfield Ct NE
- 1817 Mapleleaf Ct NE
- 1720 Springfield Place NE
- 1723 Mapleview Ct NE
- 1717 Red Maple Ct NE
- 1812 Mapleleaf Ct NE
- 1729 Mapleview Ct NE
- 1806 Springfield Place NE
- 1820 Mapleleaf Ct NE
- 1816 Mapleleaf Ct NE
- 1621 Springfield Ct NE
- 1801 Mapleview Ct NE