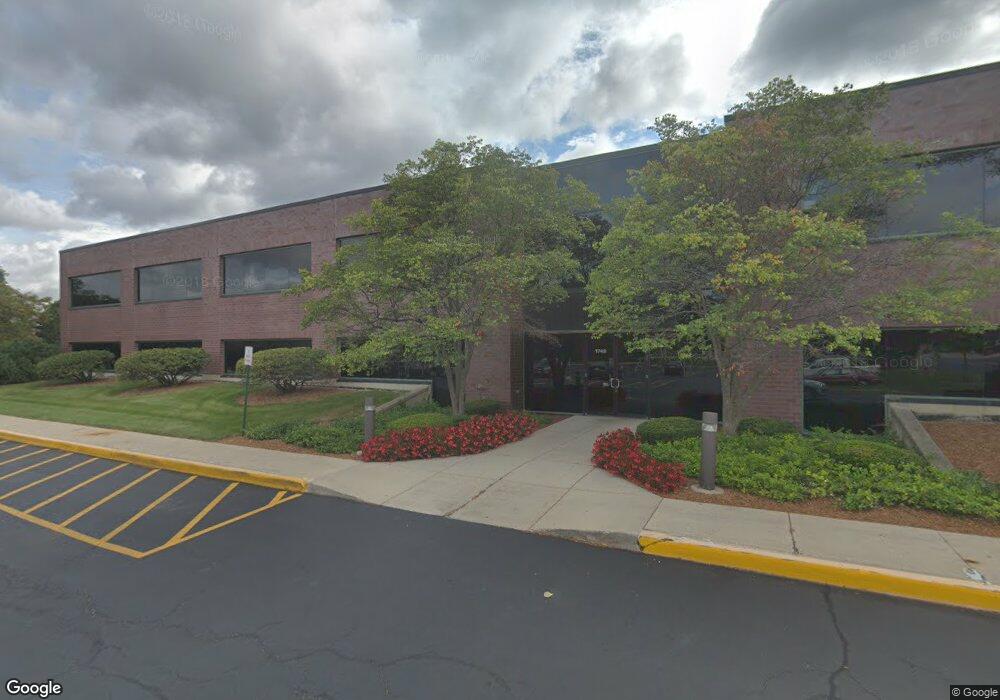
1749 S Naperville Rd Unit 105 Wheaton, IL 60189
North Danada NeighborhoodEstimated Value: $528,074
--
Bed
--
Bath
1,745
Sq Ft
$303/Sq Ft
Est. Value
About This Home
This home is located at 1749 S Naperville Rd Unit 105, Wheaton, IL 60189 and is currently estimated at $528,074, approximately $302 per square foot. 1749 S Naperville Rd Unit 105 is a home located in DuPage County with nearby schools including Lincoln Elementary School, Haines Elementary School, and Nelson Prairie School.
Ownership History
Date
Name
Owned For
Owner Type
Purchase Details
Closed on
Jul 1, 2025
Sold by
1749 Enterprises Llc
Bought by
Am Nelson Real Estate Llc
Current Estimated Value
Purchase Details
Closed on
Jul 14, 2016
Sold by
Brundage Enterprises Inc
Bought by
1749 Enterprises Llc
Purchase Details
Closed on
Nov 18, 2002
Sold by
Maag Richard J and Maag Paula J
Bought by
Brundage Enterprises Inc
Home Financials for this Owner
Home Financials are based on the most recent Mortgage that was taken out on this home.
Original Mortgage
$229,600
Interest Rate
6.38%
Mortgage Type
Commercial
Purchase Details
Closed on
Oct 27, 1997
Sold by
American National Bk & Tr Co Of Chicago
Bought by
Maag Richard J and Maag Paula J
Home Financials for this Owner
Home Financials are based on the most recent Mortgage that was taken out on this home.
Original Mortgage
$183,837
Interest Rate
7.46%
Mortgage Type
Commercial
Create a Home Valuation Report for This Property
The Home Valuation Report is an in-depth analysis detailing your home's value as well as a comparison with similar homes in the area
Home Values in the Area
Average Home Value in this Area
Purchase History
| Date | Buyer | Sale Price | Title Company |
|---|---|---|---|
| Am Nelson Real Estate Llc | $230,000 | Citywide Title Corporation | |
| 1749 Enterprises Llc | -- | Attorney | |
| Brundage Enterprises Inc | $287,000 | First American Title | |
| Maag Richard J | $167,000 | -- |
Source: Public Records
Mortgage History
| Date | Status | Borrower | Loan Amount |
|---|---|---|---|
| Previous Owner | Brundage Enterprises Inc | $229,600 | |
| Previous Owner | Maag Richard J | $183,837 |
Source: Public Records
Tax History Compared to Growth
Tax History
| Year | Tax Paid | Tax Assessment Tax Assessment Total Assessment is a certain percentage of the fair market value that is determined by local assessors to be the total taxable value of land and additions on the property. | Land | Improvement |
|---|---|---|---|---|
| 2024 | $4,755 | $73,778 | $23,825 | $49,953 |
| 2023 | $4,589 | $67,910 | $21,930 | $45,980 |
| 2022 | $4,918 | $71,020 | $20,720 | $50,300 |
| 2021 | $4,908 | $69,340 | $20,230 | $49,110 |
| 2020 | $4,894 | $68,690 | $20,040 | $48,650 |
| 2019 | $4,788 | $66,880 | $19,510 | $47,370 |
| 2018 | $6,914 | $95,460 | $19,110 | $76,350 |
| 2017 | $6,823 | $91,930 | $18,400 | $73,530 |
| 2016 | $6,745 | $88,250 | $17,660 | $70,590 |
| 2015 | $6,710 | $84,190 | $16,850 | $67,340 |
| 2014 | $6,456 | $79,620 | $15,930 | $63,690 |
| 2013 | $6,289 | $79,860 | $15,980 | $63,880 |
Source: Public Records
Map
Nearby Homes
- 24 Winners Cup Cir Unit 3
- 30 Danada Dr
- 1150 Mount Vernon Ct Unit C
- 1010 Heathrow Ct
- 1547 Huntleigh Dr
- 1631 Southampton Ct
- 1129 Rhodes Ct
- 141 Loretto Ct
- 1751 Plymouth Ct Unit B
- 1026 Briarcliffe Blvd
- 1038 Liskeard Ct
- 1888 Cheshire Ln
- 2214 Kingston Dr
- 2231 S Bradford Dr
- 1244 Loughborough Ct
- 1581 Groton Ln
- 2238 Appleby Dr
- 1219 Golf Ln
- 23W160 Woodcroft Dr
- 909 S Main St
- 1749 S Naperville Rd Unit 103
- 1749 S Naperville Rd Unit 102
- 1749 S Naperville Rd Unit 104
- 1749 S Naperville Rd
- 1749 S Naperville Rd Unit 202
- 1749 S Naperville Rd Unit 200
- 1749 S Naperville Rd Unit 207
- 1749 S Naperville Rd Unit 206
- 1749 S Naperville Rd Unit 204
- 1749 S Naperville Rd Unit 203
- 1749 S Naperville Rd
- 1749 S Naperville Rd Unit 100
- 1749 S Naperville Rd Unit 106
- 1737 S Naperville Rd Unit 106
- 1737 S Naperville Rd Unit 100
- 1737 S Naperville Rd Unit 206
- 1737 S Naperville Rd Unit 204
- 1737 S Naperville Rd Unit 103
- 1737 S Naperville Rd
- 1737 S Naperville Rd Unit 205