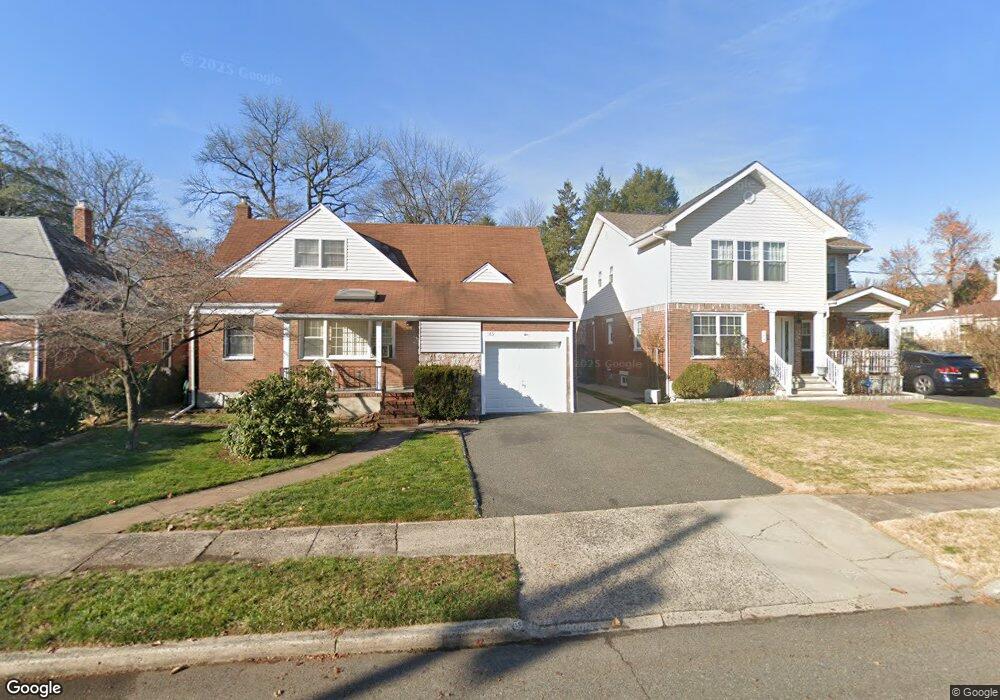
175 14th St Cresskill, NJ 07626
Estimated Value: $892,233 - $1,535,000
Studio
--
Bath
2,452
Sq Ft
$462/Sq Ft
Est. Value
About This Home
This home is located at 175 14th St, Cresskill, NJ 07626 and is currently estimated at $1,133,558, approximately $462 per square foot. 175 14th St is a home located in Bergen County with nearby schools including Cresskill High School.
Ownership History
Date
Name
Owned For
Owner Type
Purchase Details
Closed on
Sep 12, 2002
Sold by
Namgung Jade
Bought by
Mohammed Zaid and Liang Yuming
Current Estimated Value
Home Financials for this Owner
Home Financials are based on the most recent Mortgage that was taken out on this home.
Original Mortgage
$297,000
Outstanding Balance
$124,339
Interest Rate
6.27%
Estimated Equity
$1,009,219
Purchase Details
Closed on
Feb 29, 2000
Sold by
Laufer Donald C
Bought by
Namgung Jade
Home Financials for this Owner
Home Financials are based on the most recent Mortgage that was taken out on this home.
Original Mortgage
$145,000
Interest Rate
8.26%
Create a Home Valuation Report for This Property
The Home Valuation Report is an in-depth analysis detailing your home's value as well as a comparison with similar homes in the area
Home Values in the Area
Average Home Value in this Area
Purchase History
| Date | Buyer | Sale Price | Title Company |
|---|---|---|---|
| Mohammed Zaid | $330,000 | -- | |
| Namgung Jade | $242,000 | -- |
Source: Public Records
Mortgage History
| Date | Status | Borrower | Loan Amount |
|---|---|---|---|
| Open | Mohammed Zaid | $297,000 | |
| Previous Owner | Namgung Jade | $145,000 |
Source: Public Records
Tax History
| Year | Tax Paid | Tax Assessment Tax Assessment Total Assessment is a certain percentage of the fair market value that is determined by local assessors to be the total taxable value of land and additions on the property. | Land | Improvement |
|---|---|---|---|---|
| 2025 | $14,614 | $684,800 | $360,800 | $324,000 |
| 2024 | $14,133 | $635,400 | $324,000 | $311,400 |
| 2023 | $13,811 | $608,900 | $306,500 | $302,400 |
| 2022 | $13,811 | $573,800 | $284,000 | $289,800 |
| 2021 | $12,930 | $557,300 | $276,500 | $280,800 |
| 2020 | $13,215 | $543,400 | $268,000 | $275,400 |
| 2019 | $12,930 | $537,200 | $264,500 | $272,700 |
| 2018 | $8,946 | $530,600 | $261,500 | $269,100 |
| 2017 | $12,072 | $443,500 | $194,400 | $249,100 |
| 2016 | $11,713 | $443,500 | $194,400 | $249,100 |
| 2015 | $11,349 | $443,500 | $194,400 | $249,100 |
| 2014 | $11,008 | $443,500 | $194,400 | $249,100 |
Source: Public Records
Map
Nearby Homes
Your Personal Tour Guide
Ask me questions while you tour the home.