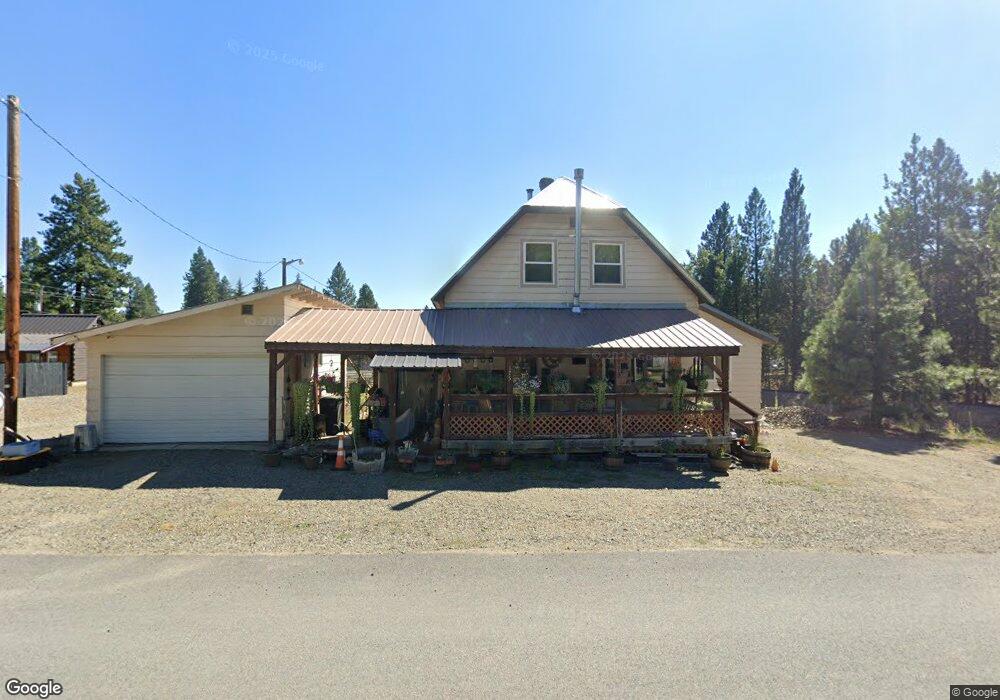
175 Austin St Sumpter, OR 97877
Estimated Value: $275,893 - $390,000
3
Beds
2
Baths
1,550
Sq Ft
$221/Sq Ft
Est. Value
About This Home
This home is located at 175 Austin St, Sumpter, OR 97877 and is currently estimated at $342,631, approximately $221 per square foot. 175 Austin St is a home located in Baker County with nearby schools including Brooklyn Primary School, Baker Middle School, and Baker High School.
Create a Home Valuation Report for This Property
The Home Valuation Report is an in-depth analysis detailing your home's value as well as a comparison with similar homes in the area
Tax History
| Year | Tax Paid | Tax Assessment Tax Assessment Total Assessment is a certain percentage of the fair market value that is determined by local assessors to be the total taxable value of land and additions on the property. | Land | Improvement |
|---|---|---|---|---|
| 2025 | $1,824 | $142,464 | $28,726 | $113,738 |
| 2024 | $1,772 | $138,315 | $31,238 | $107,077 |
| 2023 | $1,752 | $134,287 | $23,044 | $111,243 |
| 2022 | $1,709 | $130,376 | $24,056 | $106,320 |
| 2021 | $1,665 | $126,579 | $25,366 | $101,213 |
| 2020 | $1,544 | $122,893 | $20,161 | $102,732 |
| 2019 | $1,504 | $119,314 | $19,618 | $99,696 |
Source: Public Records
Map
Nearby Homes
- 379 Mill St
- 129 E Austin St
- 178 Mill St
- 206 Austin St
- 150 Mill St
- 602 S Mill St
- 08S37 Tl-1600 Unit Tax Lot 1700
- 175 N Bonanza St
- 0 Mill St Unit 176501984
- 605 NW Sumpter Valley Hwy
- 650 Sumpter Valley Hwy Unit 1803
- 0 Bourne Rd Unit 1802
- 0 Bourne Rd Unit 1801
- 0 Bourne Rd Unit 1800
- 0 Dewey St
- 600 NW Cupid Ave
- 39798 Bear Gulch Rd
- 0 Unit 24358834
- 0 North
- 0 Pinerich Rd Unit 4 119638450
- 303 Mill St
- 379 S Mill St
- 331 S Mill St
- 293 Mill St
- 363 S Mill St
- 379 Mill St
- 169 S East Austin St
- 129 Austin St
- 280 Mill St
- 270 Mill St
- 241 Mill St
- 204 S Austin St
- 275 S Austin St
- 0 Sumter Unit 9029117
- 0 Sumter Unit 9029108
- 0 Sumter Unit 9052018
- 0 Sumter Unit 13209403
- 0 Sumter Unit 14551710
- 0 Sumter Unit 14535502
- 0 Sumter Unit 14205568
Your Personal Tour Guide
Ask me questions while you tour the home.