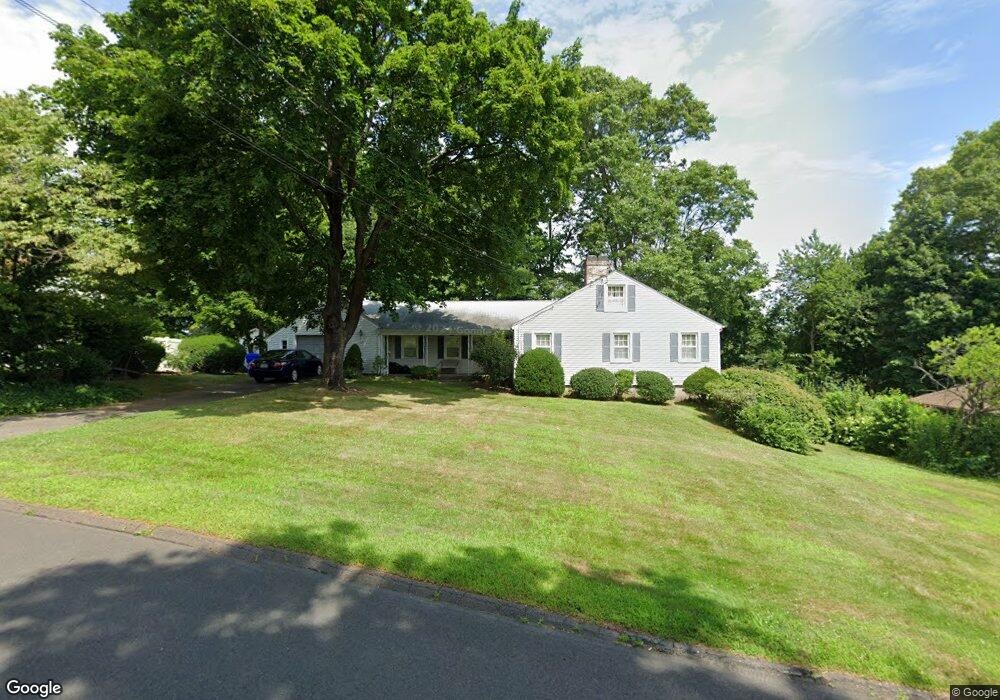
175 Bayberry Ln Rocky Hill, CT 06067
Estimated Value: $371,000 - $479,000
2
Beds
3
Baths
1,383
Sq Ft
$300/Sq Ft
Est. Value
About This Home
This home is located at 175 Bayberry Ln, Rocky Hill, CT 06067 and is currently estimated at $414,320, approximately $299 per square foot. 175 Bayberry Ln is a home located in Hartford County with nearby schools including Albert D. Griswold Middle School, Rocky Hill High School, and Corpus Christi School.
Ownership History
Date
Name
Owned For
Owner Type
Purchase Details
Closed on
Oct 19, 1995
Sold by
Mulligan James and Mullitan Gayle
Bought by
Wood Carl and Wood Virginia
Current Estimated Value
Purchase Details
Closed on
Jan 14, 1987
Sold by
Salerno Frank A
Bought by
Carlson Lennart A
Home Financials for this Owner
Home Financials are based on the most recent Mortgage that was taken out on this home.
Original Mortgage
$125,900
Interest Rate
9.26%
Mortgage Type
Purchase Money Mortgage
Create a Home Valuation Report for This Property
The Home Valuation Report is an in-depth analysis detailing your home's value as well as a comparison with similar homes in the area
Home Values in the Area
Average Home Value in this Area
Purchase History
| Date | Buyer | Sale Price | Title Company |
|---|---|---|---|
| Wood Carl | $156,000 | -- | |
| Wood Carl | $156,000 | -- | |
| Carlson Lennart A | $139,900 | -- |
Source: Public Records
Mortgage History
| Date | Status | Borrower | Loan Amount |
|---|---|---|---|
| Previous Owner | Carlson Lennart A | $145,800 | |
| Previous Owner | Carlson Lennart A | $149,400 | |
| Previous Owner | Carlson Lennart A | $125,900 |
Source: Public Records
Tax History Compared to Growth
Tax History
| Year | Tax Paid | Tax Assessment Tax Assessment Total Assessment is a certain percentage of the fair market value that is determined by local assessors to be the total taxable value of land and additions on the property. | Land | Improvement |
|---|---|---|---|---|
| 2025 | $7,307 | $241,640 | $86,520 | $155,120 |
| 2024 | $7,049 | $241,640 | $86,520 | $155,120 |
| 2023 | $6,077 | $169,190 | $73,500 | $95,690 |
| 2022 | $5,840 | $169,190 | $73,500 | $95,690 |
| 2021 | $5,769 | $169,190 | $73,500 | $95,690 |
| 2020 | $5,685 | $169,190 | $73,500 | $95,690 |
| 2019 | $5,499 | $169,190 | $73,500 | $95,690 |
| 2018 | $5,611 | $173,180 | $66,220 | $106,960 |
| 2017 | $5,472 | $173,180 | $66,220 | $106,960 |
| 2016 | $5,369 | $173,180 | $66,220 | $106,960 |
| 2015 | $5,143 | $173,180 | $66,220 | $106,960 |
| 2014 | $5,143 | $173,180 | $66,220 | $106,960 |
Source: Public Records
Map
Nearby Homes