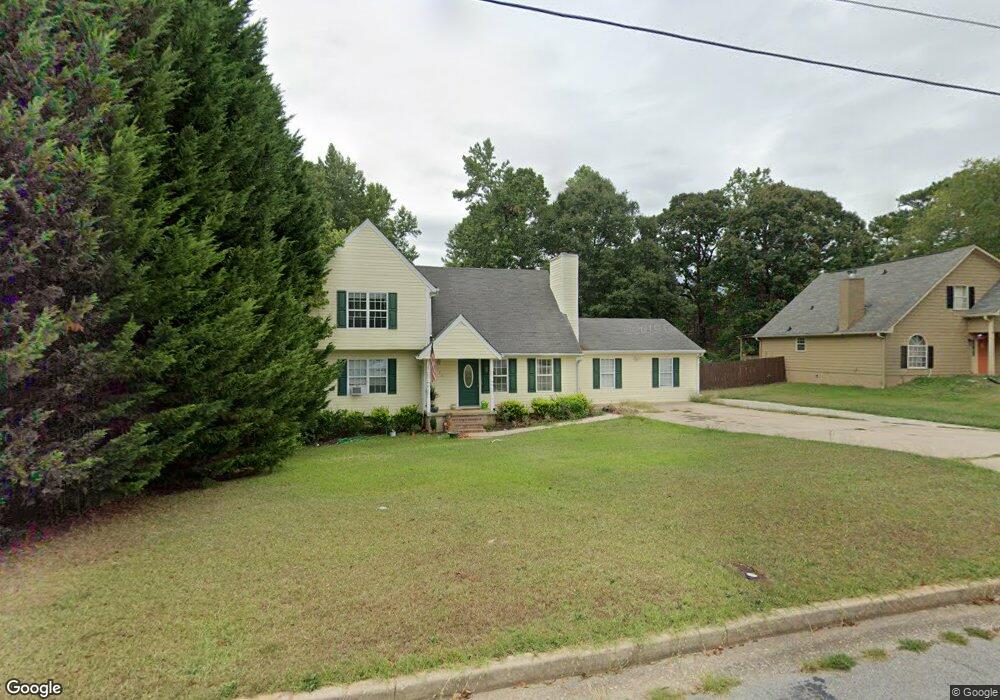
175 Bear Run Ct Palmetto, GA 30268
Estimated Value: $251,000 - $278,000
3
Beds
3
Baths
1,566
Sq Ft
$169/Sq Ft
Est. Value
About This Home
This home is located at 175 Bear Run Ct, Palmetto, GA 30268 and is currently estimated at $264,230, approximately $168 per square foot. 175 Bear Run Ct is a home located in Fulton County with nearby schools including Palmetto Elementary School, Bear Creek Middle School, and Creekside High School.
Ownership History
Date
Name
Owned For
Owner Type
Purchase Details
Closed on
Aug 8, 2008
Sold by
Indymac Federal Bank Fsb
Bought by
Mcpeek James W and Mcpeek Dalla M
Current Estimated Value
Purchase Details
Closed on
Nov 6, 2007
Sold by
Lockhart Aleisha
Bought by
Indy Mac Bank Fsb
Purchase Details
Closed on
Aug 8, 2006
Sold by
Nebil Investments Llc
Bought by
Lockhart Aleisha
Home Financials for this Owner
Home Financials are based on the most recent Mortgage that was taken out on this home.
Original Mortgage
$96,469
Interest Rate
8.38%
Mortgage Type
New Conventional
Purchase Details
Closed on
Nov 1, 2005
Sold by
Collins Jeffery L
Bought by
Nebil Investments Llc
Purchase Details
Closed on
Jun 2, 1993
Sold by
Secretary Of Hud
Bought by
Collins Jeffrey L
Home Financials for this Owner
Home Financials are based on the most recent Mortgage that was taken out on this home.
Original Mortgage
$72,934
Interest Rate
7.39%
Mortgage Type
FHA
Create a Home Valuation Report for This Property
The Home Valuation Report is an in-depth analysis detailing your home's value as well as a comparison with similar homes in the area
Home Values in the Area
Average Home Value in this Area
Purchase History
| Date | Buyer | Sale Price | Title Company |
|---|---|---|---|
| Mcpeek James W | $38,000 | -- | |
| Indy Mac Bank Fsb | $111,545 | -- | |
| Lockhart Aleisha | $121,500 | -- | |
| Nebil Investments Llc | $75,100 | -- | |
| Collins Jeffrey L | -- | -- |
Source: Public Records
Mortgage History
| Date | Status | Borrower | Loan Amount |
|---|---|---|---|
| Previous Owner | Lockhart Aleisha | $96,469 | |
| Previous Owner | Collins Jeffrey L | $72,934 |
Source: Public Records
Tax History Compared to Growth
Tax History
| Year | Tax Paid | Tax Assessment Tax Assessment Total Assessment is a certain percentage of the fair market value that is determined by local assessors to be the total taxable value of land and additions on the property. | Land | Improvement |
|---|---|---|---|---|
| 2025 | $2,788 | $81,240 | $21,680 | $59,560 |
| 2023 | $2,339 | $82,880 | $27,040 | $55,840 |
| 2022 | $2,025 | $57,360 | $14,440 | $42,920 |
| 2021 | $2,037 | $55,680 | $14,040 | $41,640 |
| 2020 | $1,813 | $47,960 | $9,560 | $38,400 |
| 2019 | $1,176 | $41,680 | $8,160 | $33,520 |
| 2018 | $1,086 | $28,400 | $5,040 | $23,360 |
| 2017 | $956 | $24,400 | $5,560 | $18,840 |
| 2016 | $979 | $24,400 | $5,560 | $18,840 |
| 2015 | $704 | $24,400 | $5,560 | $18,840 |
| 2014 | $727 | $17,480 | $4,160 | $13,320 |
Source: Public Records
Map
Nearby Homes
- 7295 Little Fawn Pkwy
- 310 Rippling Brook Trace
- 7337 Tiderace Ct
- 7360 Little Fawn Pkwy Unit 1
- 8420 Farmette Bend
- 8371 Columbia Ct Unit LOT 10
- 450 Winston Way
- 8990 Rivertown Rd
- 0 Wilkerson Mill Rd Unit 22561175
- 0 Wilkerson Mill Rd Unit 13.51+/- AC 10452830
- 7000 Petersburg Rd
- 521 Shaggy Hickory Trail
- 6220 Petersburg Rd
- 509 Chestnut Oak Dr
- 8363 Columbia Ct Unit LOT 14
- 7357 Ono Rd
- 6020 Cochran Mill Rd
- 8455 Ono Rd
- 516 Wild Cherry Ct
- 185 Bear Run Ct Unit 1
- 165 Bear Run Ct
- 195 Bear Run Ct
- 155 Bear Run Ct
- 0 Bear Run Ct Unit 7321014
- 0 Bear Run Ct Unit 7220123
- 0 Bear Run Ct Unit 7217291
- 0 Bear Run Ct Unit 3203792
- 0 Bear Run Ct Unit 8444720
- 0 Bear Run Ct Unit 8287263
- 0 Bear Run Ct Unit 8177537
- 0 Bear Run Ct Unit 8092377
- 0 Bear Run Ct Unit 7530812
- 0 Bear Run Ct Unit 7216464
- 0 Bear Run Ct Unit 8287883
- 0 Bear Run Ct Unit 8004242
- 0 Bear Run Ct Unit 3254302
- 0 Bear Run Ct Unit 3126007
- 0 Bear Run Ct Unit 8087677
- 0 Bear Run Ct Unit 7275921