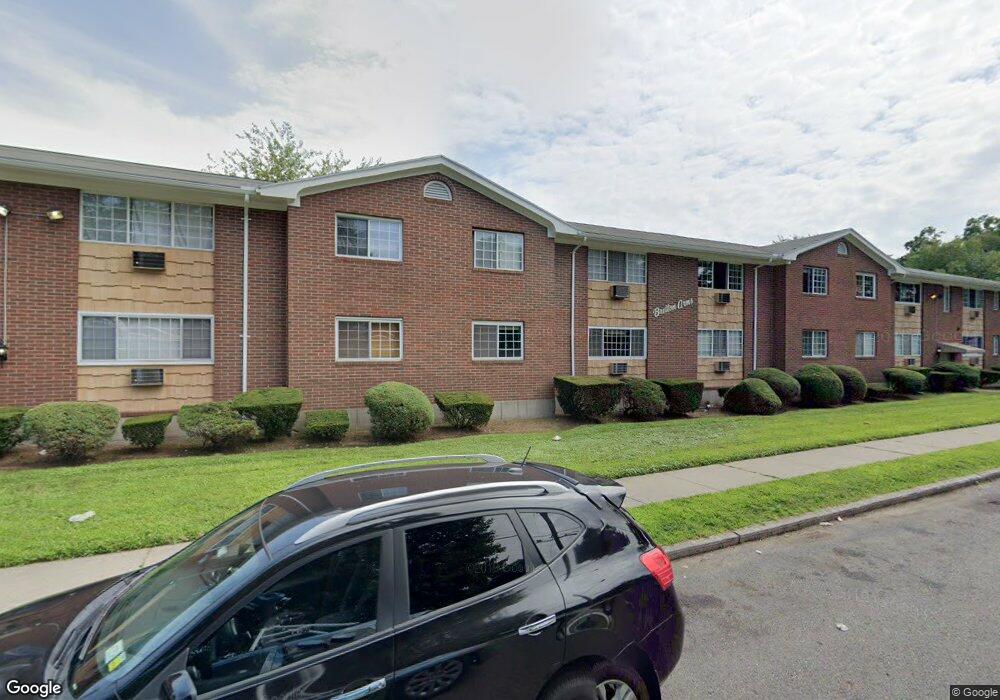
175 Bretton St Unit A8 Bridgeport, CT 06606
North End NeighborhoodEstimated Value: $128,000 - $197,627
1
Bed
1
Bath
623
Sq Ft
$259/Sq Ft
Est. Value
About This Home
This home is located at 175 Bretton St Unit A8, Bridgeport, CT 06606 and is currently estimated at $161,157, approximately $258 per square foot. 175 Bretton St Unit A8 is a home located in Fairfield County with nearby schools including Blackham School, Central High School, and Capital Prep Harbor Upper School.
Ownership History
Date
Name
Owned For
Owner Type
Purchase Details
Closed on
Jan 1, 2025
Sold by
Hasani Enkelejda
Bought by
Olken Llc
Current Estimated Value
Purchase Details
Closed on
Nov 29, 2004
Sold by
Ali Liaquat
Bought by
Kaminski Lalitha
Purchase Details
Closed on
Sep 1, 2004
Sold by
Ali Liaquat
Bought by
Hasani Enkelejda
Purchase Details
Closed on
Mar 1, 2000
Sold by
Larobina Michael D
Bought by
Li Iaquat A
Purchase Details
Closed on
Jul 2, 1996
Sold by
Larobina Michael D
Bought by
Larobina Michael D
Purchase Details
Closed on
Jun 21, 1995
Sold by
Larobina Michael
Bought by
Michael D Larobina Spa
Purchase Details
Closed on
Apr 13, 1995
Sold by
Dillon Jean
Bought by
Larobina Michael D
Create a Home Valuation Report for This Property
The Home Valuation Report is an in-depth analysis detailing your home's value as well as a comparison with similar homes in the area
Home Values in the Area
Average Home Value in this Area
Purchase History
| Date | Buyer | Sale Price | Title Company |
|---|---|---|---|
| Olken Llc | -- | None Available | |
| Olken Llc | -- | None Available | |
| Kaminski Lalitha | $85,000 | -- | |
| Kaminski Lalitha | $85,000 | -- | |
| Hasani Enkelejda | $70,000 | -- | |
| Hasani Enkelejda | $70,000 | -- | |
| Li Iaquat A | $31,000 | -- | |
| Li Iaquat A | $31,000 | -- | |
| Larobina Michael D | $17,500 | -- | |
| Larobina Michael D | $17,500 | -- | |
| Michael D Larobina Spa | $17,500 | -- | |
| Michael D Larobina Spa | $17,500 | -- | |
| Larobina Michael D | $21,500 | -- | |
| Larobina Michael D | $21,500 | -- |
Source: Public Records
Mortgage History
| Date | Status | Borrower | Loan Amount |
|---|---|---|---|
| Previous Owner | Larobina Michael D | $50,000 | |
| Previous Owner | Larobina Michael D | $15,100 |
Source: Public Records
Tax History Compared to Growth
Tax History
| Year | Tax Paid | Tax Assessment Tax Assessment Total Assessment is a certain percentage of the fair market value that is determined by local assessors to be the total taxable value of land and additions on the property. | Land | Improvement |
|---|---|---|---|---|
| 2025 | $2,056 | $47,330 | $0 | $47,330 |
| 2024 | $2,056 | $47,330 | $0 | $47,330 |
| 2023 | $2,056 | $47,330 | $0 | $47,330 |
| 2022 | $2,056 | $47,330 | $0 | $47,330 |
| 2021 | $2,056 | $47,330 | $0 | $47,330 |
| 2020 | $1,543 | $28,580 | $0 | $28,580 |
| 2019 | $1,543 | $28,580 | $0 | $28,580 |
| 2018 | $1,554 | $28,580 | $0 | $28,580 |
| 2017 | $1,554 | $28,580 | $0 | $28,580 |
| 2016 | $1,554 | $28,580 | $0 | $28,580 |
| 2015 | $2,489 | $58,970 | $0 | $58,970 |
| 2014 | $2,489 | $58,970 | $0 | $58,970 |
Source: Public Records
Map
Nearby Homes
- 520 Savoy St
- 376 Savoy St
- 485 Westfield Ave
- 631 Fairview Ave
- 681 Westfield Ave
- 234 Savoy St
- 604 Birmingham St
- 105 Tremont Ave Unit E
- 105 Tremont Ave Unit B
- 252 Harlem Ave Unit B6
- 252 Harlem Ave Unit B5
- 605 Merritt St
- 783 Clark St
- 113 Clark St
- 214 Burnsford Ave
- 3200 Park Ave Unit 11C2
- 3200 Park Ave Unit 11E2
- 203 Wayne St
- 375 Ruth St
- 932 Thorme St
- 175 Bretton St Unit B12
- 175 Bretton St Unit B11
- 175 Bretton St Unit B9
- 175 Bretton St Unit A12
- 175 Bretton St Unit A11
- 175 Bretton St Unit A10
- 175 Bretton St Unit A9
- 175 Bretton St Unit A7
- 175 Bretton St Unit A6
- 175 Bretton St Unit A5
- 175 Bretton St Unit A4
- 175 Bretton St Unit A3
- 175 Bretton St Unit A2
- 175 Bretton St Unit A1
- 175 Bretton St Unit B7
- 185 Bretton St Unit B12
- 185 Bretton St Unit B10
- 185 Bretton St Unit B8
- 185 Bretton St Unit B7
- 185 Bretton St Unit B6