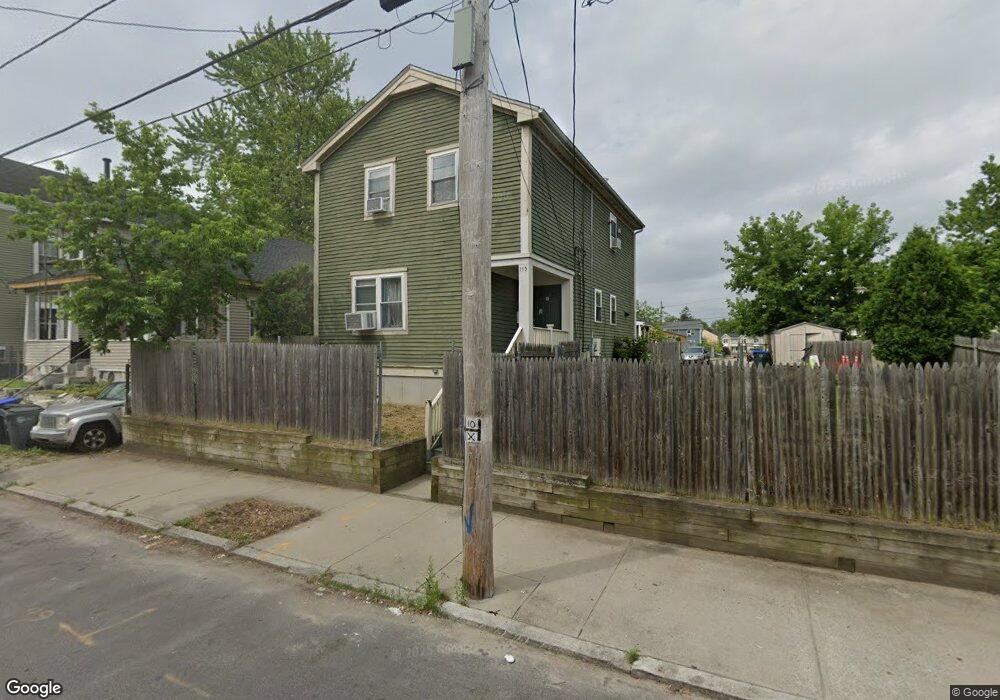
175 Burnside St Providence, RI 02905
Lower South Providence NeighborhoodEstimated Value: $387,000 - $441,821
4
Beds
3
Baths
3,024
Sq Ft
$133/Sq Ft
Est. Value
About This Home
This home is located at 175 Burnside St, Providence, RI 02905 and is currently estimated at $402,955, approximately $133 per square foot. 175 Burnside St is a home located in Providence County with nearby schools including Highlander Charter School and Bishop Mcvinney Elementary School.
Ownership History
Date
Name
Owned For
Owner Type
Purchase Details
Closed on
Jan 7, 2022
Sold by
Johnson Yeapu P
Bought by
Anderson Jessy
Current Estimated Value
Home Financials for this Owner
Home Financials are based on the most recent Mortgage that was taken out on this home.
Original Mortgage
$255,290
Outstanding Balance
$234,831
Interest Rate
3.12%
Mortgage Type
FHA
Estimated Equity
$168,124
Purchase Details
Closed on
Nov 28, 2005
Sold by
Swap Inc
Bought by
Johnson Yeapu P
Home Financials for this Owner
Home Financials are based on the most recent Mortgage that was taken out on this home.
Original Mortgage
$141,200
Interest Rate
6.06%
Mortgage Type
Purchase Money Mortgage
Purchase Details
Closed on
Dec 15, 2003
Sold by
Sedona Assoc
Bought by
Swap Inc
Create a Home Valuation Report for This Property
The Home Valuation Report is an in-depth analysis detailing your home's value as well as a comparison with similar homes in the area
Home Values in the Area
Average Home Value in this Area
Purchase History
| Date | Buyer | Sale Price | Title Company |
|---|---|---|---|
| Anderson Jessy | $260,000 | None Available | |
| Johnson Yeapu P | $159,000 | -- | |
| Swap Inc | $18,000 | -- |
Source: Public Records
Mortgage History
| Date | Status | Borrower | Loan Amount |
|---|---|---|---|
| Open | Anderson Jessy | $255,290 | |
| Previous Owner | Swap Inc | $141,200 | |
| Previous Owner | Swap Inc | $15,900 | |
| Previous Owner | Swap Inc | $2,500 | |
| Previous Owner | Swap Inc | $2,000,000 |
Source: Public Records
Tax History
| Year | Tax Paid | Tax Assessment Tax Assessment Total Assessment is a certain percentage of the fair market value that is determined by local assessors to be the total taxable value of land and additions on the property. | Land | Improvement |
|---|---|---|---|---|
| 2025 | $3,427 | $408,000 | $122,800 | $285,200 |
| 2024 | $5,668 | $308,900 | $77,800 | $231,100 |
| 2023 | $5,668 | $308,900 | $77,800 | $231,100 |
| 2022 | $5,420 | $304,500 | $77,800 | $226,700 |
| 2021 | $4,824 | $196,400 | $36,200 | $160,200 |
| 2020 | $4,824 | $196,400 | $36,200 | $160,200 |
| 2019 | $4,824 | $196,400 | $36,200 | $160,200 |
| 2018 | $4,487 | $140,400 | $33,000 | $107,400 |
| 2017 | $4,487 | $140,400 | $33,000 | $107,400 |
| 2016 | $4,487 | $140,400 | $33,000 | $107,400 |
| 2015 | $4,538 | $137,100 | $33,000 | $104,100 |
| 2014 | $4,627 | $137,100 | $33,000 | $104,100 |
| 2013 | $4,627 | $137,100 | $33,000 | $104,100 |
Source: Public Records
Map
Nearby Homes
Your Personal Tour Guide
Ask me questions while you tour the home.