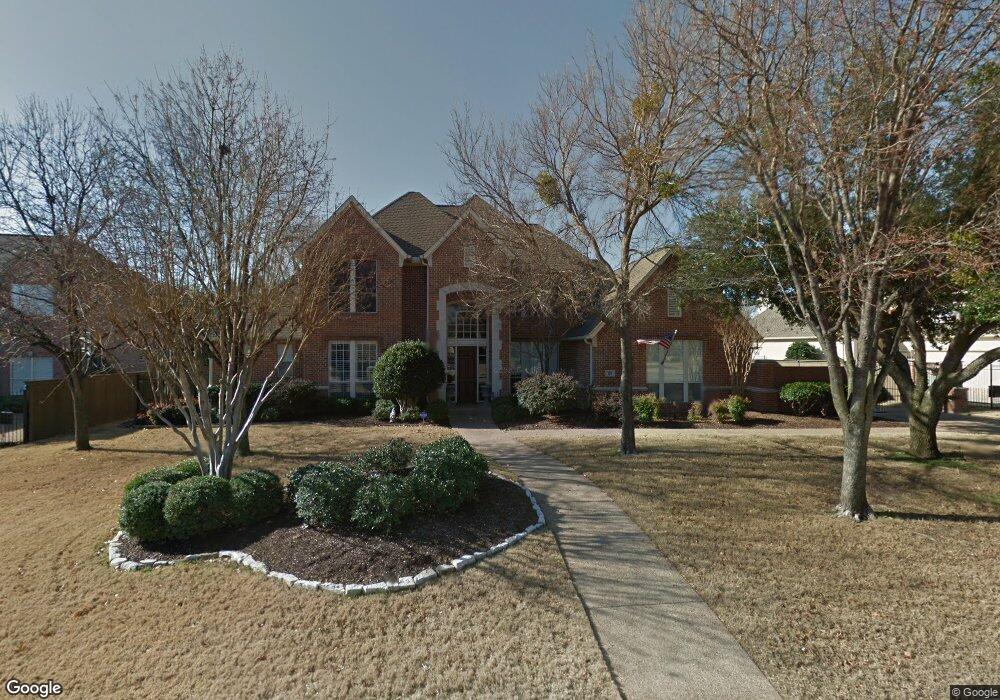
175 Creekway Bend Southlake, TX 76092
Estimated Value: $1,452,000 - $1,680,000
5
Beds
4
Baths
4,559
Sq Ft
$346/Sq Ft
Est. Value
About This Home
This home is located at 175 Creekway Bend, Southlake, TX 76092 and is currently estimated at $1,577,872, approximately $346 per square foot. 175 Creekway Bend is a home located in Tarrant County with nearby schools including Robert High Rockenbaugh Elementary School, Eubanks Intermediate School, and George Dawson Middle School.
Ownership History
Date
Name
Owned For
Owner Type
Purchase Details
Closed on
Nov 19, 2020
Sold by
Townson Veronica and Townson Kevin M
Bought by
Gizmo Living Trust
Current Estimated Value
Purchase Details
Closed on
Jun 17, 2004
Sold by
Peebles Jeffrey Smith
Bought by
Townson Kevin M and Townson Veronica
Home Financials for this Owner
Home Financials are based on the most recent Mortgage that was taken out on this home.
Original Mortgage
$333,700
Interest Rate
6.32%
Mortgage Type
Purchase Money Mortgage
Purchase Details
Closed on
Jul 12, 1996
Sold by
Sheehan Terrence P and Sheehan Terrence Patrick
Bought by
Peebles Jeffrey Smith
Purchase Details
Closed on
Aug 26, 1993
Sold by
Mccowen Sainton Inc
Bought by
Sheehan Terrence P and Sheehan Monica D
Create a Home Valuation Report for This Property
The Home Valuation Report is an in-depth analysis detailing your home's value as well as a comparison with similar homes in the area
Home Values in the Area
Average Home Value in this Area
Purchase History
| Date | Buyer | Sale Price | Title Company |
|---|---|---|---|
| Gizmo Living Trust | -- | None Listed On Document | |
| Townson Kevin M | -- | Fidelity National Title | |
| Peebles Jeffrey Smith | -- | Stewart Title | |
| Sheehan Terrence P | -- | -- |
Source: Public Records
Mortgage History
| Date | Status | Borrower | Loan Amount |
|---|---|---|---|
| Previous Owner | Townson Kevin M | $333,700 |
Source: Public Records
Tax History Compared to Growth
Tax History
| Year | Tax Paid | Tax Assessment Tax Assessment Total Assessment is a certain percentage of the fair market value that is determined by local assessors to be the total taxable value of land and additions on the property. | Land | Improvement |
|---|---|---|---|---|
| 2025 | $15,774 | $1,132,617 | $300,000 | $832,617 |
| 2024 | $15,774 | $1,366,245 | $300,000 | $1,066,245 |
| 2023 | $15,211 | $1,274,709 | $300,000 | $974,709 |
| 2022 | $18,501 | $1,084,772 | $200,000 | $884,772 |
| 2021 | $17,775 | $779,585 | $200,000 | $579,585 |
| 2020 | $17,920 | $779,585 | $200,000 | $579,585 |
| 2019 | $18,878 | $779,585 | $200,000 | $579,585 |
| 2018 | $16,854 | $737,482 | $175,000 | $562,482 |
| 2017 | $16,618 | $670,438 | $175,000 | $495,438 |
| 2016 | $16,618 | $670,438 | $175,000 | $495,438 |
| 2015 | $16,379 | $670,438 | $125,000 | $545,438 |
| 2014 | $16,379 | $675,800 | $65,000 | $610,800 |
Source: Public Records
Map
Nearby Homes
- 7312 Hix Ct
- 1227 Strathmore Dr
- 7255 Oak Alley Dr
- 900 Kingsbury Way
- TBD - Lot 3 John Mccain Rd
- TBD - Lot 1 John Mccain Rd
- 802 Princeton Ct
- 7607 Monticello Pkwy
- 7012 Shepherds Glen
- 608 Regency Crossing
- 7000 Shalimar Ct
- 1420 Kensington Ct
- 7200 Belle Meade Dr
- 7400 John Mccain Rd
- 7106 Belle Meade Dr
- 6900 Sir Spencer Ct
- 7322 Calloway Ct
- 7316 Calloway Ct
- 1417 Nottoway Ct
- 1418 Nottoway Ct
- 165 Creekway Bend
- 185 Creekway Bend
- 120 Creekwood Ct
- 145 Creekway Bend
- 110 Creekwood Ct
- 180 Creekway Bend
- 170 Creekway Bend
- 195 Creekway Bend
- 115 Creekwood Ct
- 190 Creekway Bend
- 135 Creekway Bend
- 160 Creekway Bend
- 150 Creekway Bend
- 1685 Bent Creek Dr
- 210 Bent Creek Ct
- 100 Creekwood Ct
- 205 Creekway Bend
- 1440 Bent Creek Dr
- 105 Creekwood Ct
- 140 Creekway Bend