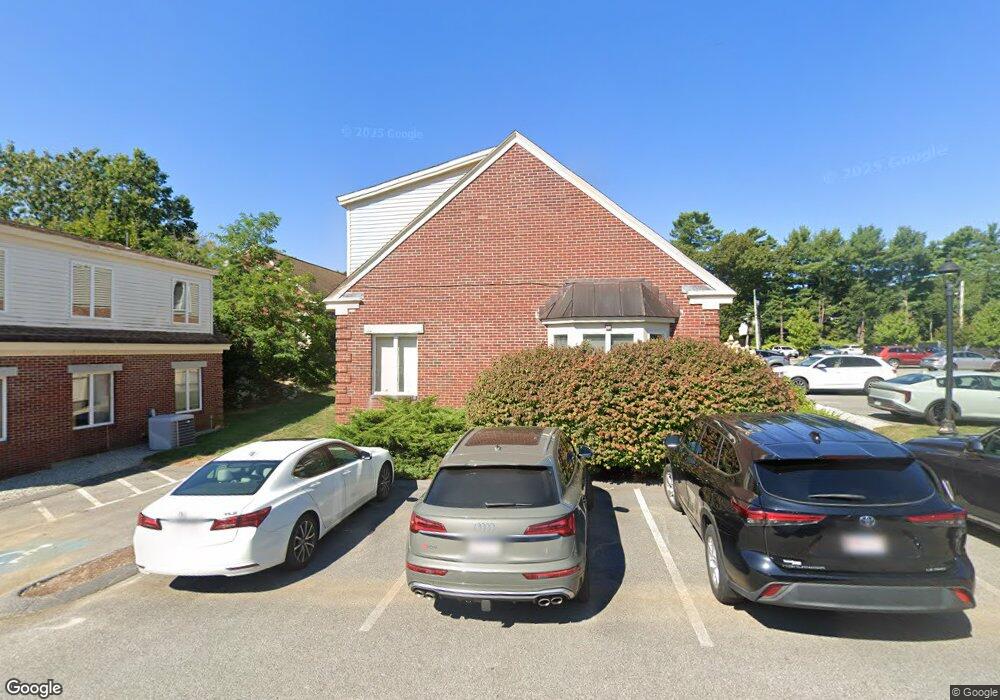
175 Derby St Unit 15 Hingham, MA 02043
South Hingham NeighborhoodEstimated Value: $393,704
Studio
--
Bath
1,763
Sq Ft
$223/Sq Ft
Est. Value
About This Home
This home is located at 175 Derby St Unit 15, Hingham, MA 02043 and is currently priced at $393,704, approximately $223 per square foot. 175 Derby St Unit 15 is a home located in Plymouth County with nearby schools including South Elementary School, Hingham Middle School, and Hingham High School.
Ownership History
Date
Name
Owned For
Owner Type
Purchase Details
Closed on
Feb 13, 2025
Sold by
Brown Linda O Est and Brown
Bought by
Buckle Up Llc
Current Estimated Value
Home Financials for this Owner
Home Financials are based on the most recent Mortgage that was taken out on this home.
Original Mortgage
$434,750
Outstanding Balance
$432,167
Interest Rate
6.91%
Mortgage Type
Purchase Money Mortgage
Purchase Details
Closed on
Feb 6, 2025
Sold by
B D Rt and Brown
Bought by
Brown Linda O Est and Brown
Home Financials for this Owner
Home Financials are based on the most recent Mortgage that was taken out on this home.
Original Mortgage
$434,750
Outstanding Balance
$432,167
Interest Rate
6.91%
Mortgage Type
Purchase Money Mortgage
Create a Home Valuation Report for This Property
The Home Valuation Report is an in-depth analysis detailing your home's value as well as a comparison with similar homes in the area
Home Values in the Area
Average Home Value in this Area
Purchase History
| Date | Buyer | Sale Price | Title Company |
|---|---|---|---|
| Buckle Up Llc | $742,500 | None Available | |
| Brown Linda O Est | -- | None Available |
Source: Public Records
Mortgage History
| Date | Status | Borrower | Loan Amount |
|---|---|---|---|
| Open | Buckle Up Llc | $434,750 |
Source: Public Records
Tax History
| Year | Tax Paid | Tax Assessment Tax Assessment Total Assessment is a certain percentage of the fair market value that is determined by local assessors to be the total taxable value of land and additions on the property. | Land | Improvement |
|---|---|---|---|---|
| 2025 | $4,123 | $385,700 | $0 | $385,700 |
| 2024 | $4,185 | $385,700 | $0 | $385,700 |
| 2023 | $3,499 | $349,900 | $0 | $349,900 |
| 2022 | $3,862 | $334,100 | $0 | $334,100 |
| 2021 | $4,101 | $347,500 | $0 | $347,500 |
| 2020 | $3,872 | $335,800 | $0 | $335,800 |
| 2019 | $3,560 | $301,400 | $0 | $301,400 |
| 2018 | $3,547 | $301,400 | $0 | $301,400 |
| 2017 | $3,788 | $309,200 | $0 | $309,200 |
| 2016 | $3,693 | $295,700 | $0 | $295,700 |
| 2015 | $3,705 | $295,700 | $0 | $295,700 |
Source: Public Records
Map
Nearby Homes
- 17 Elizabeth Ln Unit 17
- 15 Elizabeth Ln Unit 15
- 13 Elizabeth Ln Unit 13
- 9 Elizabeth Ln Unit 9
- 7 Elizabeth Ln Unit 7
- 5 Elizabeth Ln Unit 5
- 3 Elizabeth Ln Unit 3
- 1 Elizabeth Ln Unit 1
- 19 Elizabeth Ln
- 11 Elizabeth Ln
- 341 Ralph Talbot St
- 18 Whiting Ln
- 6 Macdougall Ct
- 55 Tall Oaks Dr Unit L8
- 376 Pleasant St
- 1276 Washington St Unit A
- 116 Burkhall St Unit C
- 183 Gardner St
- 175 Tall Oaks Dr Unit B
- 122 Tall Oaks Dr Unit N
- 175 Derby St Unit 18A
- 175 Derby St
- 175 Derby St Unit 7
- 175 Derby St Unit 40/43
- 175 Derby St Unit 40-44
- 175 Derby St Unit 4
- 175 Derby St Unit 40/41
- 175 Derby St Unit 9
- 175 Derby St Unit 38
- 175 Derby St Unit 13
- 175 Derby St Unit 18B
- 175 Derby St Unit 27
- 175 Derby St Unit 8
- 175 Derby St Unit 16B
- 175 Derby St Unit 16A
- 175 Derby St Unit 14
- 175 Derby St Unit 32
- 175 Derby St Unit 6
- 175 Derby St Unit 19
- 175 Derby St Unit 28
Your Personal Tour Guide
Ask me questions while you tour the home.