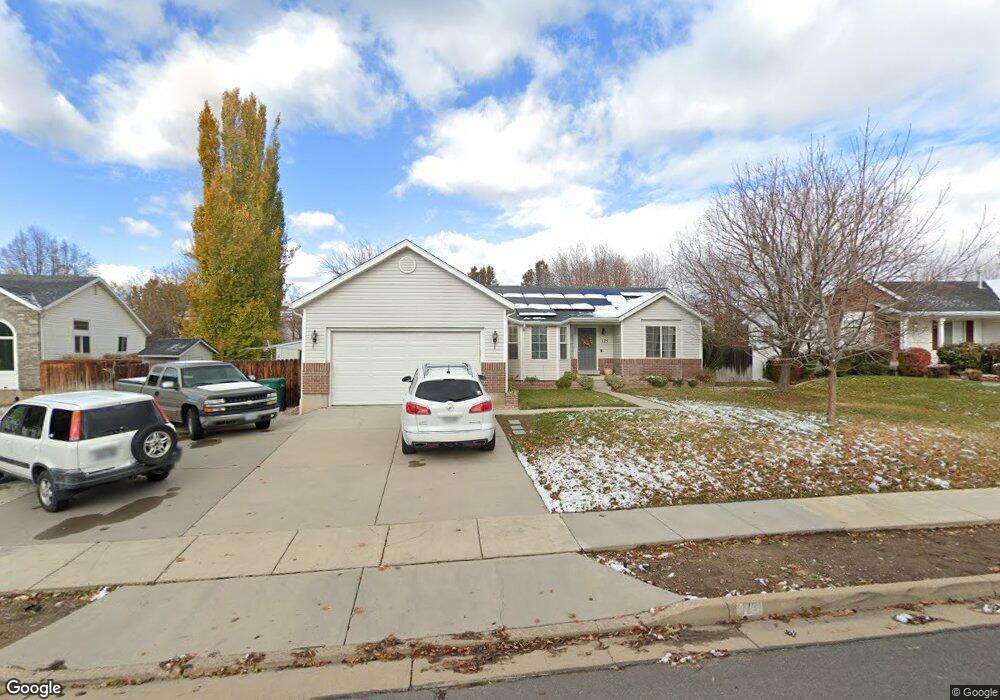
175 E 1375 N Layton, UT 84041
Estimated Value: $471,000 - $557,441
4
Beds
3
Baths
2,762
Sq Ft
$193/Sq Ft
Est. Value
About This Home
This home is located at 175 E 1375 N, Layton, UT 84041 and is currently estimated at $532,610, approximately $192 per square foot. 175 E 1375 N is a home located in Davis County with nearby schools including King Elementary School, Central Davis Junior High School, and Northridge High School.
Ownership History
Date
Name
Owned For
Owner Type
Purchase Details
Closed on
Jul 18, 2006
Sold by
Gardner Orville L and Gardner Mary Jane
Bought by
Baker Troy W and Baker Barbara R
Current Estimated Value
Home Financials for this Owner
Home Financials are based on the most recent Mortgage that was taken out on this home.
Original Mortgage
$151,000
Outstanding Balance
$89,248
Interest Rate
6.57%
Mortgage Type
Purchase Money Mortgage
Estimated Equity
$443,362
Purchase Details
Closed on
Aug 27, 1998
Sold by
Kaufman & Broad Of Utah Inc
Bought by
Gardner Orville L and Gardner Mary Jane
Home Financials for this Owner
Home Financials are based on the most recent Mortgage that was taken out on this home.
Original Mortgage
$138,076
Interest Rate
6.91%
Mortgage Type
VA
Create a Home Valuation Report for This Property
The Home Valuation Report is an in-depth analysis detailing your home's value as well as a comparison with similar homes in the area
Home Values in the Area
Average Home Value in this Area
Purchase History
| Date | Buyer | Sale Price | Title Company |
|---|---|---|---|
| Baker Troy W | -- | Heritage West Title Ins Agen | |
| Gardner Orville L | -- | First American Title Co |
Source: Public Records
Mortgage History
| Date | Status | Borrower | Loan Amount |
|---|---|---|---|
| Open | Baker Troy W | $151,000 | |
| Previous Owner | Gardner Orville L | $138,076 |
Source: Public Records
Tax History
| Year | Tax Paid | Tax Assessment Tax Assessment Total Assessment is a certain percentage of the fair market value that is determined by local assessors to be the total taxable value of land and additions on the property. | Land | Improvement |
|---|---|---|---|---|
| 2025 | $2,520 | $264,550 | $116,005 | $148,545 |
| 2024 | $2,403 | $254,100 | $134,277 | $119,823 |
| 2023 | $2,398 | $447,000 | $151,596 | $295,404 |
| 2022 | $2,489 | $251,900 | $82,523 | $169,377 |
| 2021 | $2,325 | $351,000 | $122,299 | $228,701 |
| 2020 | $2,106 | $305,000 | $100,115 | $204,885 |
| 2019 | $2,059 | $292,000 | $92,612 | $199,388 |
| 2018 | $1,868 | $266,000 | $92,612 | $173,388 |
| 2016 | $1,729 | $126,995 | $31,376 | $95,619 |
| 2015 | $1,596 | $111,265 | $31,376 | $79,889 |
| 2014 | $1,703 | $121,448 | $31,376 | $90,072 |
| 2013 | -- | $112,025 | $27,341 | $84,684 |
Source: Public Records
Map
Nearby Homes
Your Personal Tour Guide
Ask me questions while you tour the home.