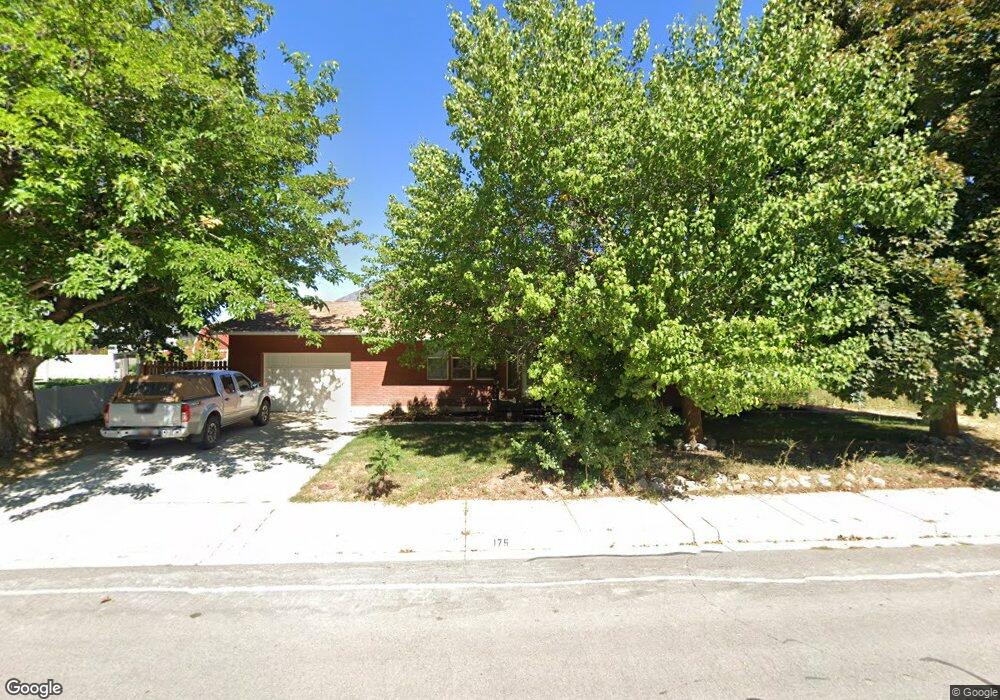
175 E 400 N Mapleton, UT 84664
Estimated Value: $495,000 - $554,483
4
Beds
3
Baths
2,464
Sq Ft
$213/Sq Ft
Est. Value
About This Home
This home is located at 175 E 400 N, Mapleton, UT 84664 and is currently estimated at $523,871, approximately $212 per square foot. 175 E 400 N is a home located in Utah County with nearby schools including Hobble Creek School, Mapleton Junior High School, and Maple Mountain High School.
Ownership History
Date
Name
Owned For
Owner Type
Purchase Details
Closed on
Apr 12, 2021
Sold by
Pack Colton and Pack Shannon
Bought by
Mann Lucas Alexander
Current Estimated Value
Home Financials for this Owner
Home Financials are based on the most recent Mortgage that was taken out on this home.
Original Mortgage
$384,750
Outstanding Balance
$346,822
Interest Rate
2.9%
Mortgage Type
New Conventional
Estimated Equity
$177,049
Purchase Details
Closed on
Apr 14, 2017
Sold by
Reel Ray Edward and Reel Sheri D
Bought by
Pack Colton and Pack Shannon
Home Financials for this Owner
Home Financials are based on the most recent Mortgage that was taken out on this home.
Original Mortgage
$249,399
Interest Rate
4.25%
Mortgage Type
FHA
Create a Home Valuation Report for This Property
The Home Valuation Report is an in-depth analysis detailing your home's value as well as a comparison with similar homes in the area
Home Values in the Area
Average Home Value in this Area
Purchase History
| Date | Buyer | Sale Price | Title Company |
|---|---|---|---|
| Mann Lucas Alexander | -- | Masters Title | |
| Pack Colton | -- | Key Land Title |
Source: Public Records
Mortgage History
| Date | Status | Borrower | Loan Amount |
|---|---|---|---|
| Open | Mann Lucas Alexander | $384,750 | |
| Previous Owner | Pack Colton | $249,399 |
Source: Public Records
Tax History
| Year | Tax Paid | Tax Assessment Tax Assessment Total Assessment is a certain percentage of the fair market value that is determined by local assessors to be the total taxable value of land and additions on the property. | Land | Improvement |
|---|---|---|---|---|
| 2025 | $2,425 | $265,210 | -- | -- |
| 2024 | $2,425 | $237,600 | $0 | $0 |
| 2023 | $2,458 | $242,275 | $0 | $0 |
| 2022 | $2,628 | $256,135 | $0 | $0 |
| 2021 | $2,172 | $325,000 | $143,800 | $181,200 |
| 2020 | $2,131 | $308,500 | $127,300 | $181,200 |
| 2019 | $1,902 | $281,100 | $122,200 | $158,900 |
| 2018 | $1,759 | $247,400 | $102,900 | $144,500 |
| 2017 | $1,716 | $128,095 | $0 | $0 |
| 2016 | $1,589 | $117,920 | $0 | $0 |
| 2015 | $1,527 | $112,640 | $0 | $0 |
| 2014 | $1,408 | $101,970 | $0 | $0 |
Source: Public Records
Map
Nearby Homes
Your Personal Tour Guide
Ask me questions while you tour the home.