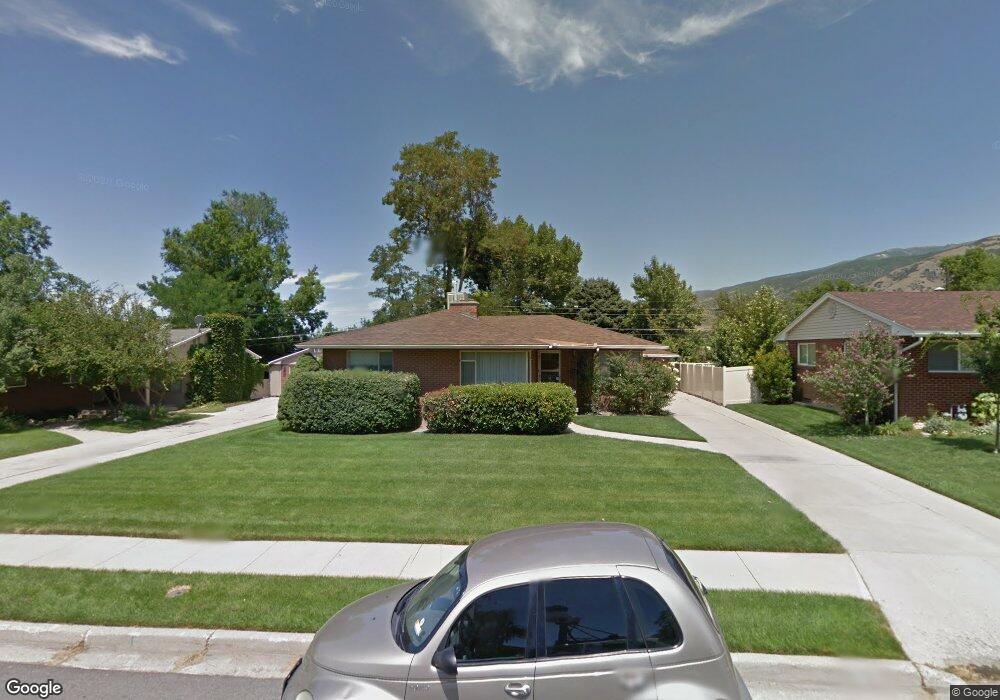
175 E 470 N Bountiful, UT 84010
Estimated Value: $524,920 - $587,000
3
Beds
3
Baths
1,459
Sq Ft
$383/Sq Ft
Est. Value
About This Home
This home is located at 175 E 470 N, Bountiful, UT 84010 and is currently estimated at $558,480, approximately $382 per square foot. 175 E 470 N is a home located in Davis County with nearby schools including Tolman School, Bountiful Junior High School, and Viewmont High School.
Ownership History
Date
Name
Owned For
Owner Type
Purchase Details
Closed on
May 31, 2022
Sold by
David Marsden
Bought by
David And Kimberly Marsden Trust
Current Estimated Value
Purchase Details
Closed on
Feb 27, 2013
Sold by
Marsden David
Bought by
Marsden David and Marsden Kimberly
Home Financials for this Owner
Home Financials are based on the most recent Mortgage that was taken out on this home.
Original Mortgage
$196,033
Interest Rate
3.25%
Mortgage Type
FHA
Create a Home Valuation Report for This Property
The Home Valuation Report is an in-depth analysis detailing your home's value as well as a comparison with similar homes in the area
Purchase History
| Date | Buyer | Sale Price | Title Company |
|---|---|---|---|
| David And Kimberly Marsden Trust | -- | None Listed On Document | |
| Marsden David | -- | Bonneville Superior Title Co | |
| Marsden David | -- | Bonneville Superior Title Co |
Source: Public Records
Mortgage History
| Date | Status | Borrower | Loan Amount |
|---|---|---|---|
| Previous Owner | Marsden David | $196,033 |
Source: Public Records
Tax History
| Year | Tax Paid | Tax Assessment Tax Assessment Total Assessment is a certain percentage of the fair market value that is determined by local assessors to be the total taxable value of land and additions on the property. | Land | Improvement |
|---|---|---|---|---|
| 2025 | $3,502 | $282,150 | $139,646 | $142,504 |
| 2024 | $3,206 | $273,900 | $127,037 | $146,863 |
| 2023 | $3,093 | $478,000 | $231,639 | $246,361 |
| 2022 | $3,352 | $280,500 | $125,931 | $154,569 |
| 2021 | $2,851 | $396,000 | $164,898 | $231,102 |
| 2020 | $2,701 | $351,000 | $139,989 | $211,011 |
| 2019 | $2,226 | $284,000 | $142,442 | $141,558 |
| 2018 | $2,014 | $258,000 | $139,480 | $118,520 |
| 2016 | $1,620 | $109,780 | $59,798 | $49,982 |
| 2015 | $1,597 | $102,025 | $59,798 | $42,227 |
| 2014 | $1,605 | $106,073 | $59,798 | $46,275 |
| 2013 | -- | $99,829 | $43,945 | $55,884 |
Source: Public Records
Map
Nearby Homes
- 17 E 400 N Unit 19B
- 453 N 400 E Unit 7-D
- 513 N 400 E Unit 14B
- 49 E 200 N Unit 4
- 41 E 200 N Unit 6
- 252 N Main St
- 256 N Main St
- 254 N Main St
- 55 E 200 N Unit 2
- 51 E 200 N Unit 3
- 978 N 170 E
- 106 W 700 N
- 320 N 200 W Unit 4
- 214 E 1250 N
- 499 N 200 W Unit 30
- 499 N 200 W Unit 19
- 563 N 200 W
- 332 N 300 W
- 1130 N 200 W
- 1420 N Main St
Your Personal Tour Guide
Ask me questions while you tour the home.