Estimated Value: $374,000 - $388,000
3
Beds
2
Baths
1,708
Sq Ft
$224/Sq Ft
Est. Value
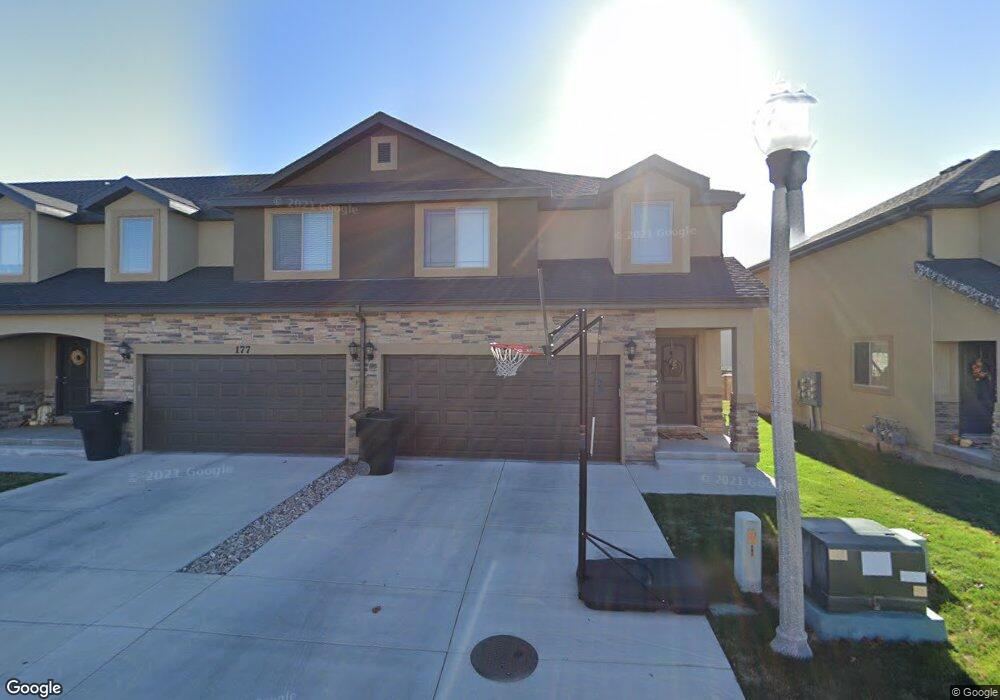
About This Home
This home is located at 175 E 560 N, Salem, UT 84653 and is currently estimated at $381,746, approximately $223 per square foot. 175 E 560 N is a home with nearby schools including Salem Elementary, Salem Junior High School, and Valley View Middle School.
Ownership History
Date
Name
Owned For
Owner Type
Purchase Details
Closed on
Jan 30, 2026
Sold by
Bosone Kacie M
Bought by
Kacie M Bosone Family Trust and Bosone
Current Estimated Value
Purchase Details
Closed on
Jul 2, 2018
Sold by
Bosone Kacie M and Johnson Kacie M
Bought by
Bosone Kacie M
Home Financials for this Owner
Home Financials are based on the most recent Mortgage that was taken out on this home.
Original Mortgage
$16,000
Interest Rate
4.6%
Mortgage Type
Purchase Money Mortgage
Purchase Details
Closed on
Jul 29, 2015
Sold by
Salem Townhomes Llc
Bought by
Johnson Kacie M
Home Financials for this Owner
Home Financials are based on the most recent Mortgage that was taken out on this home.
Original Mortgage
$188,775
Interest Rate
4.05%
Mortgage Type
New Conventional
Create a Home Valuation Report for This Property
The Home Valuation Report is an in-depth analysis detailing your home's value as well as a comparison with similar homes in the area
Home Values in the Area
Average Home Value in this Area
Purchase History
| Date | Buyer | Sale Price | Title Company |
|---|---|---|---|
| Kacie M Bosone Family Trust | -- | None Listed On Document | |
| Bosone Kacie M | -- | First American Title | |
| Johnson Kacie M | -- | Wasatch Land & Title | |
| Salem Townhomes Llc | -- | Wasatch Land & Title |
Source: Public Records
Mortgage History
| Date | Status | Borrower | Loan Amount |
|---|---|---|---|
| Previous Owner | Bosone Kacie M | $16,000 | |
| Previous Owner | Salem Townhomes Llc | $188,775 |
Source: Public Records
Tax History
| Year | Tax Paid | Tax Assessment Tax Assessment Total Assessment is a certain percentage of the fair market value that is determined by local assessors to be the total taxable value of land and additions on the property. | Land | Improvement |
|---|---|---|---|---|
| 2025 | $1,935 | $195,855 | -- | -- |
| 2024 | $1,935 | $196,240 | $0 | $0 |
| 2023 | $1,877 | $190,685 | $0 | $0 |
| 2022 | $2,062 | $206,305 | $0 | $0 |
| 2021 | $1,757 | $282,000 | $42,300 | $239,700 |
| 2020 | $1,583 | $260,900 | $39,100 | $221,800 |
| 2019 | $1,583 | $252,500 | $32,800 | $219,700 |
| 2018 | $1,500 | $228,700 | $28,000 | $200,700 |
| 2017 | $1,369 | $111,320 | $0 | $0 |
| 2016 | $1,259 | $101,200 | $0 | $0 |
Source: Public Records
Map
Nearby Homes
- 625 N 220 E
- 685-1197 N 1850 E
- 689-1198 N 1850 E
- 685 N 220 E
- 703 N 150 E
- 737 N 150 E
- 1223 N 360 E Unit 129
- 1212 N 360 E Unit 132
- 1195 N 360 E Unit 127
- 1241 N 360 E Unit 130
- 1238 N 360 E Unit 133
- 1207 N 360 E Unit 128
- 1165 N 360 E Unit 75
- 16 W 650 N
- 394 E 500 N Unit LOT 15
- 1176 N 250 E Unit 71
- 415 E 500 N Unit LOT 18
- 422 N 550 E
- 52 W 650 N Unit 3
- 655 N 410 E Lot #15 E
Your Personal Tour Guide
Ask me questions while you tour the home.