175 E Dunstable Rd Nashua, NH 03062
Southwest Nashua NeighborhoodEstimated Value: $506,565 - $555,000
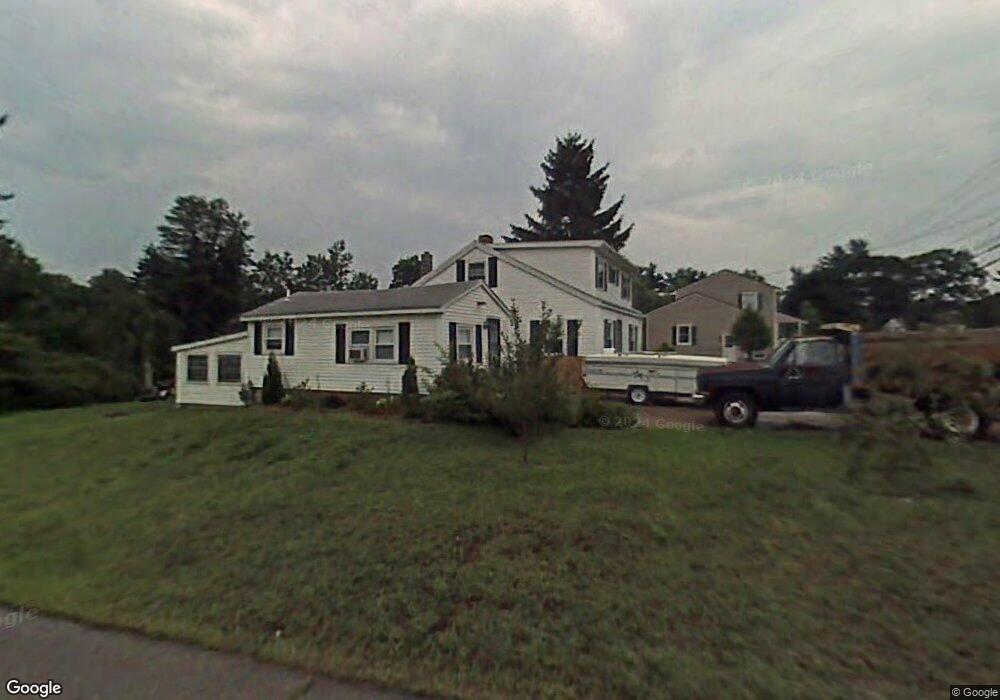
About This Home
This home is located at 175 E Dunstable Rd, Nashua, NH 03062 and is currently estimated at $533,891, approximately $365 per square foot. 175 E Dunstable Rd is a home located in Hillsborough County with nearby schools including Bicentennial Elementary School, Fairgrounds Middle School, and Nashua High School South.
Ownership History
We collect this data history from publicly available records. To have your information removed, we recommend requesting removal directly through your county’s website.
Purchase Details
Purchase Details
Home Financials for this Owner
Home Financials are based on the most recent Mortgage that was taken out on this home.Home Values in the Area
Average Home Value in this Area
Purchase History
We collect this data history from publicly available records. To have your information removed, we recommend requesting removal directly through your county’s website.
| Date | Buyer | Sale Price | Title Company |
|---|---|---|---|
| -- | None Available | ||
| $106,000 | -- |
Mortgage History
We collect this data history from publicly available records. To have your information removed, we recommend requesting removal directly through your county’s website.
| Date | Status | Borrower | Loan Amount |
|---|---|---|---|
| Previous Owner | $75,000 | ||
| Previous Owner | $80,000 | ||
| Previous Owner | $104,340 |
Tax History
We collect this data history from publicly available records. To have your information removed, we recommend requesting removal directly through your county’s website.
| Year | Tax Paid | Tax Assessment Tax Assessment Total Assessment is a certain percentage of the fair market value that is determined by local assessors to be the total taxable value of land and additions on the property. | Land | Improvement |
|---|---|---|---|---|
| 2025 | $7,319 | $434,900 | $162,200 | $272,700 |
| 2024 | $6,915 | $434,900 | $162,200 | $272,700 |
| 2023 | $6,515 | $357,400 | $129,700 | $227,700 |
| 2022 | $6,458 | $357,400 | $129,700 | $227,700 |
| 2021 | $5,635 | $242,700 | $86,500 | $156,200 |
| 2020 | $5,487 | $242,700 | $86,500 | $156,200 |
| 2019 | $5,281 | $242,700 | $86,500 | $156,200 |
| 2018 | $5,148 | $242,700 | $86,500 | $156,200 |
| 2017 | $4,843 | $187,800 | $82,100 | $105,700 |
| 2016 | $4,708 | $187,800 | $82,100 | $105,700 |
| 2015 | $4,607 | $187,800 | $82,100 | $105,700 |
| 2014 | $4,517 | $187,800 | $82,100 | $105,700 |
Map
- 7 Raleigh Dr
- 20 Taschereau Blvd
- 29 Dickens St
- 10 Oakdale Ave
- 122 Westwood Dr
- 3 Aspen Ct
- 22 Greenwood Dr
- 119 Westwood Dr
- 7 Wilmington St
- 4 Spindlewick Dr
- 6 Killian Dr Unit U17
- 21 Clearview Dr
- 24 Killian Dr Unit U37
- 2 Queensway Cir
- 256 E Dunstable Rd
- 41 Nottingham Dr
- 3 Rainbow Dr
- 50 Langholm Dr
- 15 Spencer Dr
- 26 Tenby Dr
Ask me questions while you tour the home.