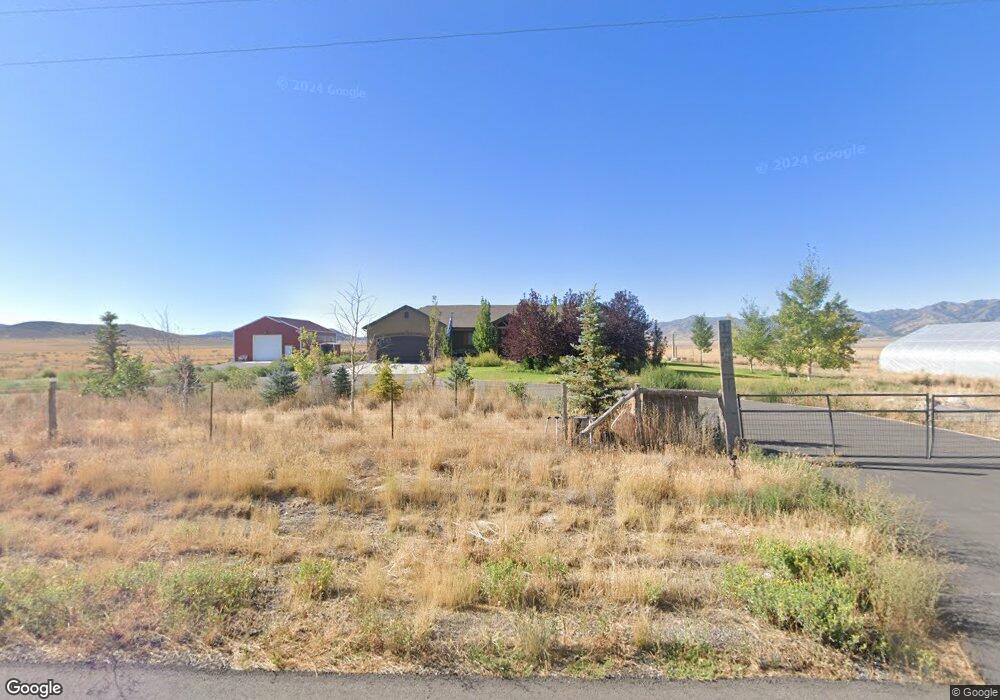
175 E Sharp Rd Vernon, UT 84080
Estimated Value: $449,000 - $1,063,487
6
Beds
3
Baths
3,559
Sq Ft
$221/Sq Ft
Est. Value
About This Home
This home is located at 175 E Sharp Rd, Vernon, UT 84080 and is currently estimated at $785,496, approximately $220 per square foot. 175 E Sharp Rd is a home located in Tooele County with nearby schools including Vernon Elementary School and Dugway.
Ownership History
Date
Name
Owned For
Owner Type
Purchase Details
Closed on
Nov 30, 2022
Sold by
Oviatt Theo
Bought by
Norcross Steven
Current Estimated Value
Purchase Details
Closed on
Feb 3, 2022
Sold by
Allen Tronrud Jr Jeffrey
Bought by
Oviatt Theo
Purchase Details
Closed on
Sep 8, 2017
Sold by
Christiansen Hans Christian and Christiansen Hollie Marie
Bought by
Tronrud Jeffrey Allen and Tronrud Becky Jane
Home Financials for this Owner
Home Financials are based on the most recent Mortgage that was taken out on this home.
Original Mortgage
$445,500
Interest Rate
3.9%
Mortgage Type
New Conventional
Create a Home Valuation Report for This Property
The Home Valuation Report is an in-depth analysis detailing your home's value as well as a comparison with similar homes in the area
Home Values in the Area
Average Home Value in this Area
Purchase History
| Date | Buyer | Sale Price | Title Company |
|---|---|---|---|
| Norcross Steven | -- | Novation Title Insurance Agenc | |
| Oviatt Theo | -- | None Listed On Document | |
| Oviatt Theo | -- | Integrated Title | |
| Tronrud Jeffrey Allen | -- | Highland Title |
Source: Public Records
Mortgage History
| Date | Status | Borrower | Loan Amount |
|---|---|---|---|
| Previous Owner | Tronrud Jeffrey Allen | $445,500 |
Source: Public Records
Tax History Compared to Growth
Tax History
| Year | Tax Paid | Tax Assessment Tax Assessment Total Assessment is a certain percentage of the fair market value that is determined by local assessors to be the total taxable value of land and additions on the property. | Land | Improvement |
|---|---|---|---|---|
| 2025 | $5,415 | $489,332 | $80,368 | $408,964 |
| 2024 | $5,415 | $491,973 | $80,368 | $411,605 |
| 2023 | $5,415 | $944,993 | $502,659 | $442,334 |
| 2022 | $2,431 | $249,747 | $41,346 | $208,401 |
| 2021 | $2,832 | $243,051 | $41,346 | $201,705 |
| 2020 | $2,794 | $465,295 | $85,460 | $379,835 |
| 2019 | $3,027 | $496,928 | $85,460 | $411,468 |
| 2018 | $3,895 | $479,744 | $72,690 | $407,054 |
| 2017 | $1,589 | $293,898 | $69,503 | $224,395 |
| 2016 | $1,631 | $130,414 | $6,997 | $123,417 |
| 2015 | $1,631 | $130,414 | $0 | $0 |
| 2014 | -- | $130,414 | $0 | $0 |
Source: Public Records
Map
Nearby Homes
- 183 N Silver Sage Rd
- 421 W Larson Rd
- 750 S 1150 W
- 500 S Silver Ave W
- 100 E Pine St N
- 311 S Highway 199
- 315 S Highway 199
- 71 N Church St
- 26 Gear St
- 475 Utah 36
- 215 W Railroad St
- 163 Eagle St
- 11 W Main St
- 163 S Eagle St
- 81 S T St
- 151 S Haulage Rd
- 50 Pine St
- 260 E Leadville Row
- 325 S Beck St
- 81 Sandy Ln
- 163 E Sharp Rd
- 81 E Sharp Rd
- 395 S Main St
- 355 Main St
- 279 S Main St
- 334 S Main St
- 332 S Main St
- 278 S Main St
- 52 N Silver Sage Rd
- 47 S Main St
- 191 E Mountain View Ln
- 180 E Mountain View Ln
- 78 S Main St
- 10 N Main St
- 30 N Silver Sage Rd
- 30 N Silver Sage Rd Unit 4
- 192 E Mountain View Ln
- 30 N Main St
- 15 N Main St
- 15 N Main St