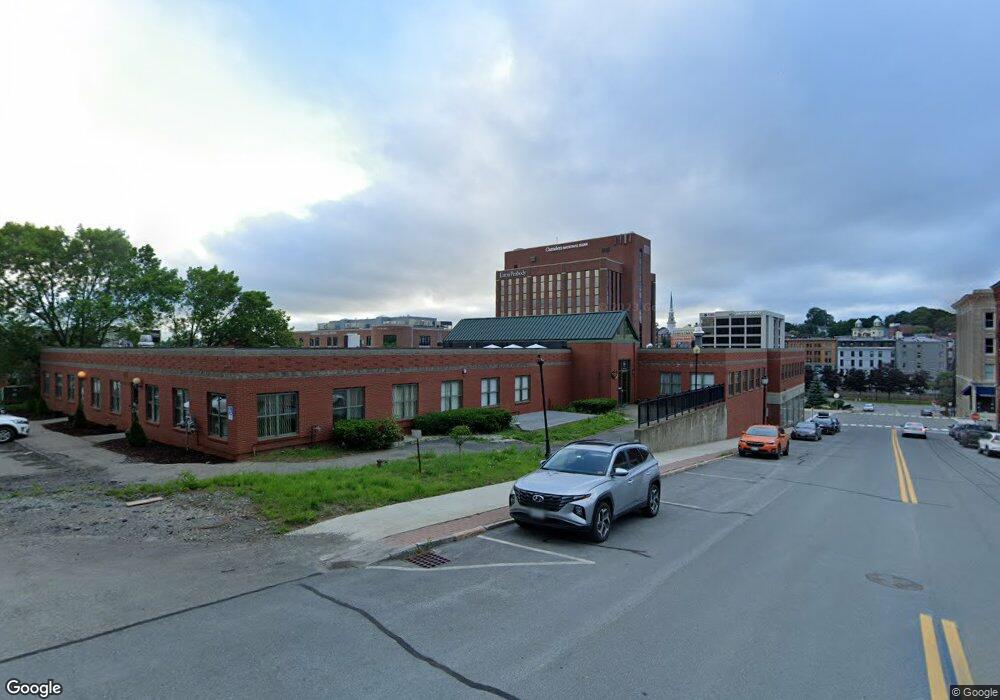
175 Exchange St Bangor, ME 04401
Downtown Bangor NeighborhoodEstimated Value: $2,899,914
--
Bed
--
Bath
60,000
Sq Ft
$48/Sq Ft
Est. Value
About This Home
This home is located at 175 Exchange St, Bangor, ME 04401 and is currently estimated at $2,899,914, approximately $48 per square foot. 175 Exchange St is a home located in Penobscot County with nearby schools including Abraham Lincoln School, Mary Snow School, and William S. Cohen School.
Ownership History
Date
Name
Owned For
Owner Type
Purchase Details
Closed on
Aug 9, 2017
Sold by
Springer Lawrence E
Bought by
175 Exchange Llc
Current Estimated Value
Home Financials for this Owner
Home Financials are based on the most recent Mortgage that was taken out on this home.
Original Mortgage
$1,000,000
Outstanding Balance
$832,615
Interest Rate
3.88%
Mortgage Type
Commercial
Estimated Equity
$2,067,299
Purchase Details
Closed on
Aug 4, 2015
Sold by
Houlton Band Of Maliseet
Bought by
Springer L E
Create a Home Valuation Report for This Property
The Home Valuation Report is an in-depth analysis detailing your home's value as well as a comparison with similar homes in the area
Home Values in the Area
Average Home Value in this Area
Purchase History
| Date | Buyer | Sale Price | Title Company |
|---|---|---|---|
| 175 Exchange Llc | -- | -- | |
| Springer L E | -- | -- |
Source: Public Records
Mortgage History
| Date | Status | Borrower | Loan Amount |
|---|---|---|---|
| Open | 175 Exchange Llc | $1,000,000 |
Source: Public Records
Tax History Compared to Growth
Tax History
| Year | Tax Paid | Tax Assessment Tax Assessment Total Assessment is a certain percentage of the fair market value that is determined by local assessors to be the total taxable value of land and additions on the property. | Land | Improvement |
|---|---|---|---|---|
| 2024 | $47,781 | $2,488,600 | $205,000 | $2,283,600 |
| 2023 | $44,446 | $2,252,700 | $205,000 | $2,047,700 |
| 2022 | $44,596 | $2,130,700 | $205,000 | $1,925,700 |
| 2021 | $43,594 | $1,954,900 | $189,800 | $1,765,100 |
| 2020 | $44,307 | $1,909,800 | $189,800 | $1,720,000 |
| 2019 | $43,790 | $1,903,900 | $189,800 | $1,714,100 |
| 2018 | $44,209 | $1,926,300 | $189,800 | $1,736,500 |
| 2017 | $58,708 | $1,912,100 | $189,800 | $1,722,300 |
| 2016 | $72,272 | $3,212,100 | $315,500 | $2,896,600 |
| 2015 | $69,823 | $3,181,000 | $315,500 | $2,865,500 |
| 2014 | $72,217 | $3,312,700 | $315,500 | $2,997,200 |
| 2013 | $67,825 | $3,260,800 | $315,500 | $2,945,300 |
Source: Public Records
Map
Nearby Homes
- 187 Exchange St
- 191 Exchange St
- 92 Oak St Unit 6
- 92 Oak St Unit 2
- 92 Oak St Unit 17
- 92 Oak St Unit 21
- 92 Oak St Unit 7
- 92 Oak St
- 205 Exchange St
- 811 York St
- 807 York St
- 833 York St
- 809 York St
- 832 York St
- 213 Exchange St
- 202 Exchange St
- 33 State St
- 33 & 45 State St
- 148 French St Unit 3
- 148 French St