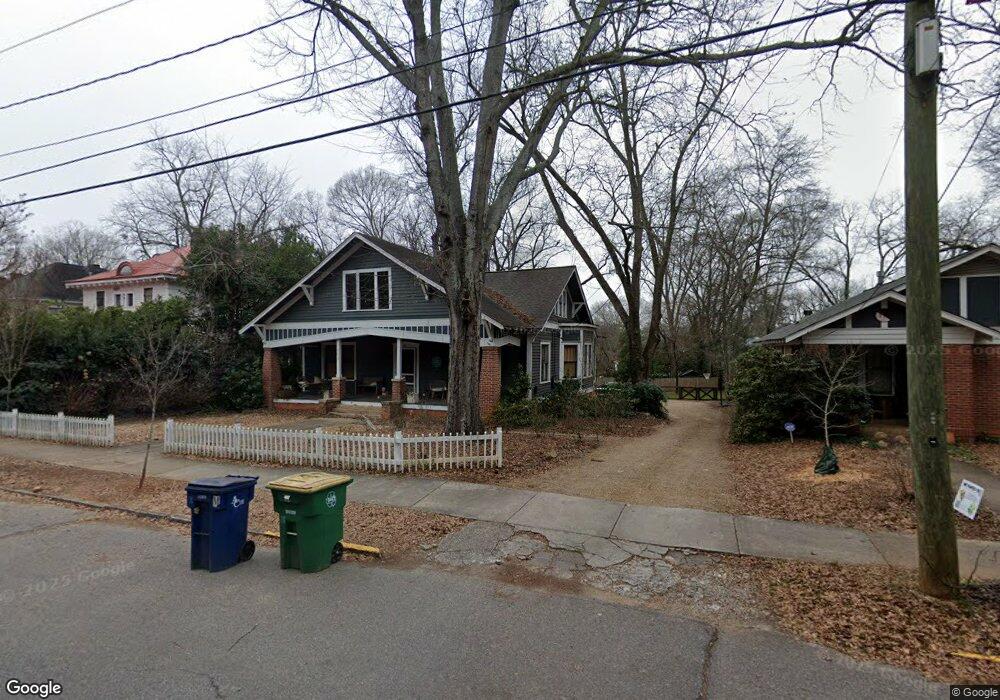
175 Grady Ave Athens, GA 30601
Boulevard NeighborhoodEstimated Value: $618,000 - $972,000
5
Beds
4
Baths
2,691
Sq Ft
$306/Sq Ft
Est. Value
About This Home
This home is located at 175 Grady Ave, Athens, GA 30601 and is currently estimated at $824,623, approximately $306 per square foot. 175 Grady Ave is a home located in Clarke County with nearby schools including Johnnie Lay Burks Elementary School, Clarke Middle School, and Clarke Central High School.
Ownership History
Date
Name
Owned For
Owner Type
Purchase Details
Closed on
Feb 19, 2021
Sold by
Nesmith David W
Bought by
Crowe Kelly Williams and Crowe Elizabeth
Current Estimated Value
Home Financials for this Owner
Home Financials are based on the most recent Mortgage that was taken out on this home.
Original Mortgage
$400,000
Outstanding Balance
$356,939
Interest Rate
2.7%
Mortgage Type
New Conventional
Estimated Equity
$467,684
Purchase Details
Closed on
Feb 1, 2019
Sold by
Boom Time Llc
Bought by
Nesmith David W and Nesmith Elizabeth B
Home Financials for this Owner
Home Financials are based on the most recent Mortgage that was taken out on this home.
Original Mortgage
$320,000
Interest Rate
4.5%
Mortgage Type
New Conventional
Purchase Details
Closed on
Jan 2, 2014
Sold by
A B Stiles Enterprises Lll
Bought by
Boom Time Llc
Purchase Details
Closed on
Nov 15, 1999
Sold by
Stiles Alwyn B
Bought by
A B Stiles Enterprises Lllp
Create a Home Valuation Report for This Property
The Home Valuation Report is an in-depth analysis detailing your home's value as well as a comparison with similar homes in the area
Home Values in the Area
Average Home Value in this Area
Purchase History
| Date | Buyer | Sale Price | Title Company |
|---|---|---|---|
| Crowe Kelly Williams | $680,000 | -- | |
| Nesmith David W | $400,000 | -- | |
| Boom Time Llc | $1,205,000 | -- | |
| A B Stiles Enterprises Lllp | -- | -- |
Source: Public Records
Mortgage History
| Date | Status | Borrower | Loan Amount |
|---|---|---|---|
| Open | Crowe Kelly Williams | $400,000 | |
| Previous Owner | Nesmith David W | $320,000 |
Source: Public Records
Tax History
| Year | Tax Paid | Tax Assessment Tax Assessment Total Assessment is a certain percentage of the fair market value that is determined by local assessors to be the total taxable value of land and additions on the property. | Land | Improvement |
|---|---|---|---|---|
| 2025 | $9,484 | $305,440 | $65,000 | $240,440 |
| 2024 | $9,484 | $277,721 | $60,000 | $217,721 |
| 2023 | $8,679 | $259,369 | $55,000 | $204,369 |
| 2022 | $7,043 | $220,792 | $55,000 | $165,792 |
| 2021 | $5,315 | $157,703 | $55,000 | $102,703 |
| 2020 | $5,315 | $157,703 | $55,000 | $102,703 |
| 2019 | $3,045 | $89,685 | $50,000 | $39,685 |
| 2018 | $2,875 | $84,685 | $45,000 | $39,685 |
| 2017 | $2,875 | $84,685 | $45,000 | $39,685 |
| 2016 | $2,875 | $84,685 | $45,000 | $39,685 |
| 2015 | $2,879 | $84,685 | $45,000 | $39,685 |
| 2014 | $2,716 | $79,764 | $40,000 | $39,764 |
Source: Public Records
Map
Nearby Homes
- 570 Prince Ave
- 524 Hill St
- 668 Pulaski St
- 100 Prince Ave Unit A404
- 100 Prince Ave Unit A407
- 947 N Chase St
- 600 Pulaski St
- 390 Athens Ave
- 860 College Ave
- 940 College Ave
- 1196 W Hancock Ave Unit 1
- 800 College Ave
- 1198 W West Hancock Ave W
- 923 Hill St
- 269 N Hull St Unit 212
- 189 Glenhaven Ave
- 458 Dearing St
- 250 W Broad St Unit 615
- 250 W Broad St Unit 714
- 250 W Broad St Unit 801
- 179 Grady Ave
- 171 Grady Ave
- 183 Grady Ave
- 169 Grady Ave
- 185 Grady Ave
- 159 Virginia Ave
- 189 Grady Ave
- 169 Virginia Ave
- 167 Grady Ave
- 149 Virginia Ave
- 173 Virginia Ave
- 170 Grady Ave
- 147 Virginia Ave
- 193 Grady Ave
- 157 Grady Ave
- 174 Grady Ave
- 179 Virginia Ave
- 172 Grady Ave
- 180 Grady Ave
- 137 Virginia Ave
Your Personal Tour Guide
Ask me questions while you tour the home.