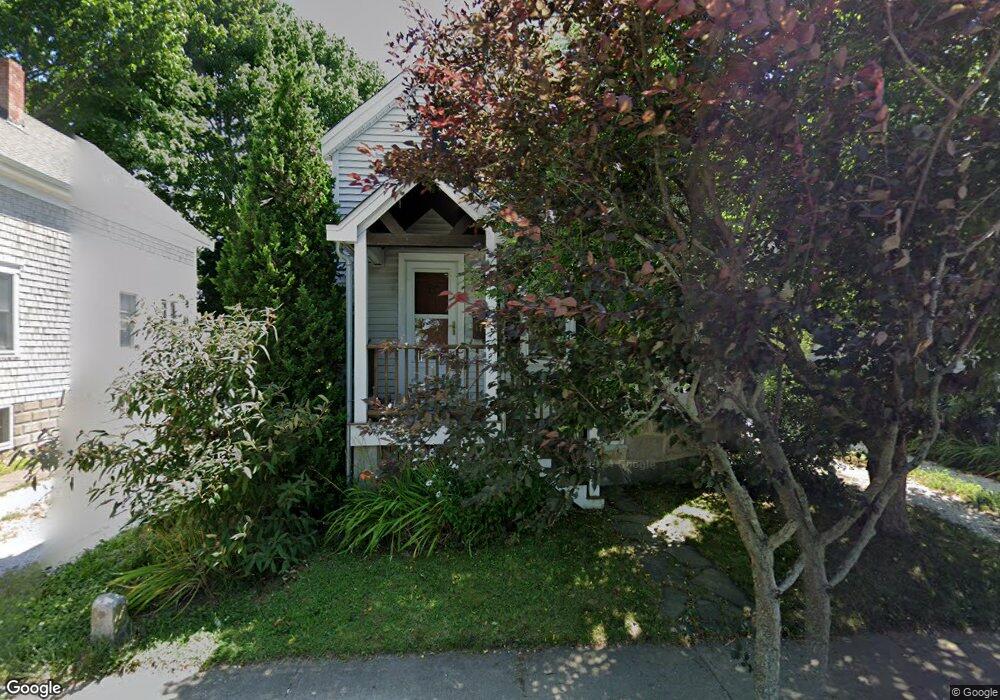
175 Green St Fairhaven, MA 02719
Estimated Value: $383,000 - $404,000
3
Beds
1
Bath
924
Sq Ft
$428/Sq Ft
Est. Value
About This Home
This home is located at 175 Green St, Fairhaven, MA 02719 and is currently estimated at $395,316, approximately $427 per square foot. 175 Green St is a home located in Bristol County with nearby schools including Fairhaven High School, City On A Hill Charter Public School New Bedford, and St. Joseph School.
Ownership History
Date
Name
Owned For
Owner Type
Purchase Details
Closed on
Mar 11, 2002
Sold by
Mckenna Charlotte A
Bought by
Dyer Michael P and Oneill Jennifer L
Current Estimated Value
Home Financials for this Owner
Home Financials are based on the most recent Mortgage that was taken out on this home.
Original Mortgage
$119,900
Interest Rate
7.01%
Mortgage Type
Purchase Money Mortgage
Create a Home Valuation Report for This Property
The Home Valuation Report is an in-depth analysis detailing your home's value as well as a comparison with similar homes in the area
Home Values in the Area
Average Home Value in this Area
Purchase History
| Date | Buyer | Sale Price | Title Company |
|---|---|---|---|
| Dyer Michael P | $149,900 | -- |
Source: Public Records
Mortgage History
| Date | Status | Borrower | Loan Amount |
|---|---|---|---|
| Open | Dyer Michael P | $117,250 | |
| Closed | Dyer Michael P | $119,900 |
Source: Public Records
Tax History
| Year | Tax Paid | Tax Assessment Tax Assessment Total Assessment is a certain percentage of the fair market value that is determined by local assessors to be the total taxable value of land and additions on the property. | Land | Improvement |
|---|---|---|---|---|
| 2025 | $2,838 | $304,500 | $169,800 | $134,700 |
| 2024 | $2,750 | $297,900 | $169,800 | $128,100 |
| 2023 | $2,668 | $268,100 | $148,700 | $119,400 |
| 2022 | $2,584 | $252,800 | $138,200 | $114,600 |
| 2021 | $2,454 | $217,400 | $125,000 | $92,400 |
| 2020 | $2,404 | $217,400 | $125,000 | $92,400 |
| 2019 | $3,549 | $188,800 | $103,700 | $85,100 |
| 2018 | $3,614 | $178,900 | $98,700 | $80,200 |
| 2017 | $3,253 | $172,000 | $98,700 | $73,300 |
| 2016 | $2,018 | $165,700 | $98,700 | $67,000 |
| 2015 | $1,995 | $164,200 | $98,700 | $65,500 |
Source: Public Records
Map
Nearby Homes
Your Personal Tour Guide
Ask me questions while you tour the home.