175 Groover St Leesburg, GA 31763
Estimated Value: $200,000 - $215,000
3
Beds
2
Baths
1,395
Sq Ft
$148/Sq Ft
Est. Value
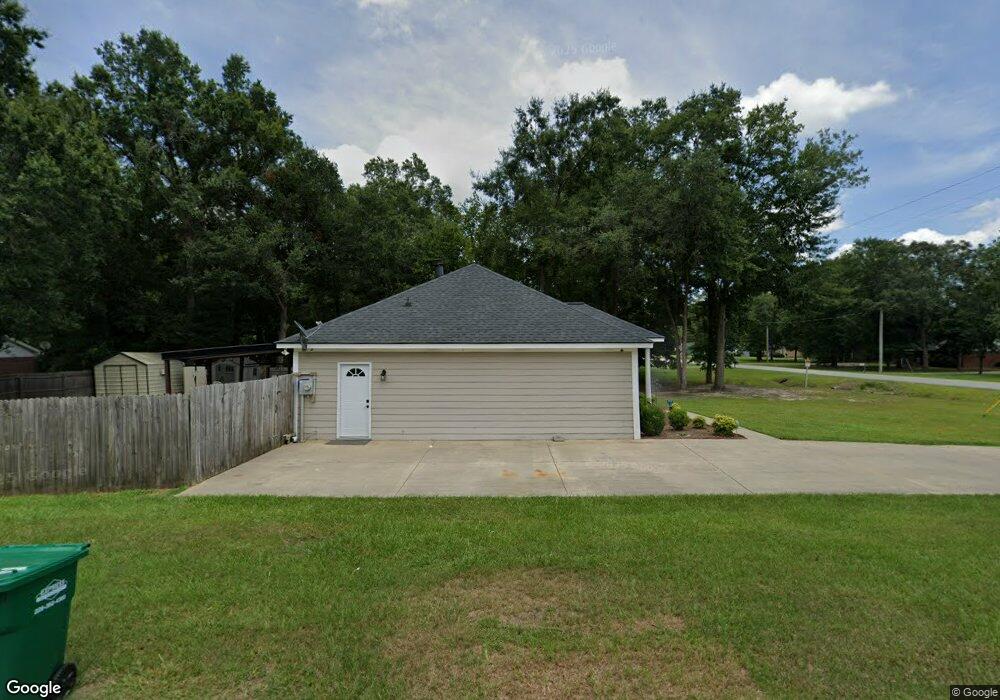
About This Home
This home is located at 175 Groover St, Leesburg, GA 31763 and is currently estimated at $206,832, approximately $148 per square foot. 175 Groover St is a home located in Lee County with nearby schools including Kinchafoonee Primary School, Twin Oaks Elementary School, and Lee County Middle School East.
Ownership History
Date
Name
Owned For
Owner Type
Purchase Details
Closed on
Jun 29, 2021
Sold by
Gilbert Gary L
Bought by
Krk Rosalyn J
Current Estimated Value
Purchase Details
Closed on
Feb 26, 2016
Sold by
Galloway Bonita M
Bought by
Gilbert Gary L and Gilbert Charley Y
Home Financials for this Owner
Home Financials are based on the most recent Mortgage that was taken out on this home.
Original Mortgage
$118,251
Interest Rate
3.79%
Mortgage Type
New Conventional
Purchase Details
Closed on
Dec 30, 2014
Sold by
Galloway Bonita M
Bought by
Galloway Bonita M and Hilldore Larry
Purchase Details
Closed on
Dec 23, 2014
Sold by
United States Of America
Bought by
Galloway Bonita
Purchase Details
Closed on
Apr 1, 2014
Sold by
United States Of America
Bought by
United States Of America
Purchase Details
Closed on
Dec 1, 2003
Sold by
Morris Jeremy A
Bought by
Morris Jeremy A
Purchase Details
Closed on
Sep 4, 1996
Sold by
B & W Enterprises
Bought by
Southeastern Prop
Create a Home Valuation Report for This Property
The Home Valuation Report is an in-depth analysis detailing your home's value as well as a comparison with similar homes in the area
Home Values in the Area
Average Home Value in this Area
Purchase History
| Date | Buyer | Sale Price | Title Company |
|---|---|---|---|
| Krk Rosalyn J | $155,000 | -- | |
| Gilbert Gary L | $115,000 | -- | |
| Galloway Bonita M | -- | -- | |
| Galloway Bonita M | -- | -- | |
| Galloway Bonita | $76,500 | -- | |
| United States Of America | $82,842 | -- | |
| Morris Jeremy A | -- | -- | |
| Morris Jeremy A | $95,300 | -- | |
| Southeastern Prop | $63,000 | -- |
Source: Public Records
Mortgage History
| Date | Status | Borrower | Loan Amount |
|---|---|---|---|
| Previous Owner | Gilbert Gary L | $118,251 |
Source: Public Records
Tax History Compared to Growth
Tax History
| Year | Tax Paid | Tax Assessment Tax Assessment Total Assessment is a certain percentage of the fair market value that is determined by local assessors to be the total taxable value of land and additions on the property. | Land | Improvement |
|---|---|---|---|---|
| 2024 | $2,052 | $58,840 | $8,000 | $50,840 |
| 2023 | $1,933 | $58,840 | $8,000 | $50,840 |
| 2022 | $1,567 | $55,600 | $8,000 | $47,600 |
| 2021 | $1,871 | $55,600 | $8,000 | $47,600 |
| 2020 | $1,376 | $41,560 | $9,000 | $32,560 |
| 2019 | $1,400 | $41,560 | $9,000 | $32,560 |
| 2018 | $1,401 | $41,560 | $9,000 | $32,560 |
| 2017 | $1,326 | $41,560 | $9,000 | $32,560 |
| 2016 | $1,326 | $41,560 | $9,000 | $32,560 |
| 2015 | $982 | $41,560 | $9,000 | $32,560 |
| 2014 | $1,338 | $41,560 | $9,000 | $32,560 |
| 2013 | -- | $41,560 | $9,000 | $32,560 |
Source: Public Records
Map
Nearby Homes
- 201 Groover St
- 258 Fire Tower Rd
- 102 Sautee Ct
- 102 Society St
- 182 Canal St
- 178 Old Stage Rd
- 1564 State Hwy 32w
- 1591 E US Hwy 32
- 134 Brookfair Ln
- 143 Tallassee Trail
- 154 Morgan Farm Rd
- 105 Fortner Ct
- 134 Danville Dr
- 249 Morgan Farm Dr
- 118 Blue Springs Dr
- 98 Senah Dr
- 152 Senah Dr
- 159 Senah Dr
- 163 Northwood Dr
- 127 Northwood Dr
- 100 Unicoi Ct
- 179 Groover St
- 169 Groover St
- 102 Unicoi Ct
- 183 Groover St
- 101 Unicoi Ct
- 178 Groover St
- 172 Groover St
- 104 Unicoi Ct
- 105 Unicoi Ct
- 165 Groover St
- 182 Groover St
- 168 Groover St
- 115 Brasstown Ct
- 0 Unicoi Ct Unit 7380855
- 0 Unicoi Ct
- 186 Groover St
- 164 Groover St
- 107 Unicoi Ct
- 106 Unicoi Ct