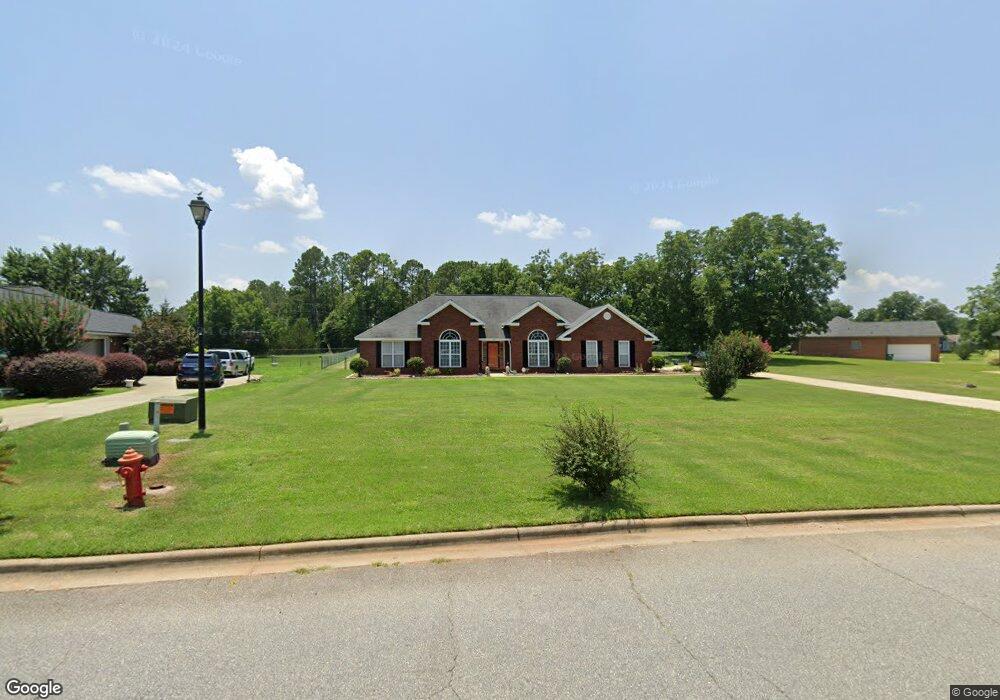
175 Hawkstead Dr Leesburg, GA 31763
Estimated Value: $299,005 - $340,000
4
Beds
2
Baths
2,158
Sq Ft
$148/Sq Ft
Est. Value
About This Home
This home is located at 175 Hawkstead Dr, Leesburg, GA 31763 and is currently estimated at $319,251, approximately $147 per square foot. 175 Hawkstead Dr is a home located in Lee County with nearby schools including Lee County Primary School, Lee County Elementary School, and Lee County Middle School - West Campus.
Ownership History
Date
Name
Owned For
Owner Type
Purchase Details
Closed on
Jan 31, 2011
Sold by
Davis Stacey
Bought by
Davis James E and Davis Evelyn
Current Estimated Value
Home Financials for this Owner
Home Financials are based on the most recent Mortgage that was taken out on this home.
Original Mortgage
$190,000
Outstanding Balance
$130,074
Interest Rate
4.79%
Mortgage Type
VA
Estimated Equity
$189,177
Purchase Details
Closed on
Jan 11, 2007
Sold by
Weeks Robert Todd
Bought by
Winfield Stacey D
Home Financials for this Owner
Home Financials are based on the most recent Mortgage that was taken out on this home.
Original Mortgage
$182,400
Interest Rate
6.08%
Mortgage Type
New Conventional
Purchase Details
Closed on
Feb 1, 2003
Sold by
Ray Lloyd Realty
Bought by
Weeks Robert T
Purchase Details
Closed on
Sep 1, 2002
Sold by
Holly Plantation Par
Bought by
Ray Lloyd Realty
Create a Home Valuation Report for This Property
The Home Valuation Report is an in-depth analysis detailing your home's value as well as a comparison with similar homes in the area
Home Values in the Area
Average Home Value in this Area
Purchase History
| Date | Buyer | Sale Price | Title Company |
|---|---|---|---|
| Davis James E | $190,000 | -- | |
| Winfield Stacey D | $192,000 | -- | |
| Weeks Robert T | $166,900 | -- | |
| Ray Lloyd Realty | -- | -- |
Source: Public Records
Mortgage History
| Date | Status | Borrower | Loan Amount |
|---|---|---|---|
| Open | Davis James E | $190,000 | |
| Closed | Winfield Stacey D | $182,400 |
Source: Public Records
Tax History
| Year | Tax Paid | Tax Assessment Tax Assessment Total Assessment is a certain percentage of the fair market value that is determined by local assessors to be the total taxable value of land and additions on the property. | Land | Improvement |
|---|---|---|---|---|
| 2024 | -- | $86,360 | $8,000 | $78,360 |
| 2023 | $0 | $86,360 | $8,000 | $78,360 |
| 2022 | $2,438 | $86,360 | $8,000 | $78,360 |
| 2021 | $2,438 | $86,360 | $8,000 | $78,360 |
| 2020 | $2,030 | $63,280 | $10,160 | $53,120 |
| 2019 | $2,067 | $63,280 | $10,160 | $53,120 |
| 2018 | $2,067 | $63,280 | $10,160 | $53,120 |
| 2017 | $1,957 | $63,280 | $10,160 | $53,120 |
| 2016 | $1,957 | $63,280 | $10,160 | $53,120 |
| 2015 | $1,967 | $63,280 | $10,160 | $53,120 |
| 2014 | $2,335 | $74,480 | $11,960 | $62,520 |
| 2013 | -- | $74,480 | $11,960 | $62,520 |
Source: Public Records
Map
Nearby Homes
- 112 Barrondale Ct
- 164 Ambleside Dr
- 112 Beowulf Ln
- 107 Beowulf Ln
- 5004 Edith Dr
- 285 Hawkstead Dr
- 324 Ambleside Dr
- 108 Lambeth Ct
- 109 Lambeth Ct
- 112 Lambeth Ct
- 270 Wiregrass Way
- 118 Bay Ct
- 123 Larkspur Dr
- 2700 Mccall Ct
- 196 Winnstead Dr
- 134 Silver Leaf Dr
- 193 Winnstead Dr
- 4302 Old Dawson Rd
- 227 Longleaf Dr
- 2813 W Doublegate Dr
- 179 Hawkstead Dr
- 198 Ambleside Dr
- 192 Ambleside Dr
- 183 Hawkstead Dr
- 188 Ambleside Dr
- 178 Hawkstead Dr
- 172 Hawkstead Dr
- 189 Hawkstead Dr
- 184 Hawkstead Dr
- 199 Ambleside Dr
- 191 Ambleside Dr
- 184 Ambleside Dr
- 210 Ambleside Dr
- 207 Ambleside Dr
- 193 Hawkstead Dr
- 190 Hawkstead Dr
- 4919 Edith Dr
- 185 Ambleside Dr
- 196 Hawkstead Dr
- 211 Ambleside Dr
Your Personal Tour Guide
Ask me questions while you tour the home.