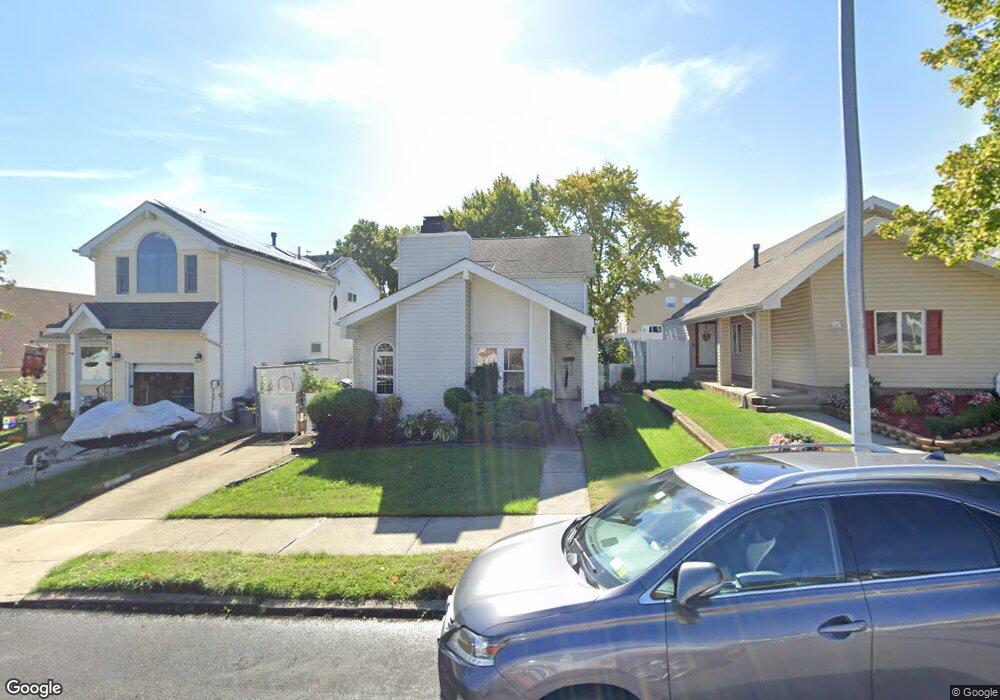
175 Heffernan St Staten Island, NY 10312
Arden Heights NeighborhoodEstimated Value: $788,000 - $924,000
3
Beds
2
Baths
2,350
Sq Ft
$365/Sq Ft
Est. Value
About This Home
This home is located at 175 Heffernan St, Staten Island, NY 10312 and is currently estimated at $857,192, approximately $364 per square foot. 175 Heffernan St is a home located in Richmond County with nearby schools including P.S. 42 The Eltingville School, I.S. 075 Frank D. Paulo, and Tottenville High School.
Ownership History
Date
Name
Owned For
Owner Type
Purchase Details
Closed on
Sep 27, 2019
Sold by
Kim Calvin P
Bought by
Kim Calvin P and Kim Hyo Kyung
Current Estimated Value
Purchase Details
Closed on
Jul 19, 2006
Sold by
Urraco Valentin and Urraco Susan
Bought by
Kim Calvin P
Home Financials for this Owner
Home Financials are based on the most recent Mortgage that was taken out on this home.
Original Mortgage
$416,000
Outstanding Balance
$243,130
Interest Rate
6.37%
Mortgage Type
New Conventional
Estimated Equity
$614,062
Purchase Details
Closed on
Jul 24, 2000
Sold by
Cook Michael F and Cook Maria E
Bought by
Urraco Valentin and Urraco Susan
Home Financials for this Owner
Home Financials are based on the most recent Mortgage that was taken out on this home.
Original Mortgage
$220,144
Interest Rate
8.21%
Mortgage Type
FHA
Create a Home Valuation Report for This Property
The Home Valuation Report is an in-depth analysis detailing your home's value as well as a comparison with similar homes in the area
Home Values in the Area
Average Home Value in this Area
Purchase History
| Date | Buyer | Sale Price | Title Company |
|---|---|---|---|
| Kim Calvin P | -- | Dabora Abstract Corp | |
| Kim Calvin P | $520,000 | Old Republic National Title | |
| Urraco Valentin | $222,000 | -- |
Source: Public Records
Mortgage History
| Date | Status | Borrower | Loan Amount |
|---|---|---|---|
| Open | Kim Calvin P | $416,000 | |
| Previous Owner | Urraco Valentin | $220,144 |
Source: Public Records
Tax History Compared to Growth
Tax History
| Year | Tax Paid | Tax Assessment Tax Assessment Total Assessment is a certain percentage of the fair market value that is determined by local assessors to be the total taxable value of land and additions on the property. | Land | Improvement |
|---|---|---|---|---|
| 2025 | $7,225 | $57,420 | $6,415 | $51,005 |
| 2024 | $7,225 | $46,920 | $7,406 | $39,514 |
| 2023 | $7,306 | $35,972 | $7,368 | $28,604 |
| 2022 | $7,127 | $38,340 | $9,660 | $28,680 |
| 2021 | $7,088 | $40,440 | $9,660 | $30,780 |
| 2020 | $6,726 | $37,860 | $9,660 | $28,200 |
| 2019 | $6,271 | $41,100 | $9,660 | $31,440 |
| 2018 | $6,111 | $29,977 | $8,542 | $21,435 |
| 2017 | $6,065 | $29,751 | $9,638 | $20,113 |
| 2016 | $5,611 | $28,067 | $7,998 | $20,069 |
| 2015 | $4,794 | $26,479 | $7,125 | $19,354 |
| 2014 | $4,794 | $24,981 | $7,168 | $17,813 |
Source: Public Records
Map
Nearby Homes
- 1192 Arthur Kill Rd
- 48 Hinton St
- 46 Billings St
- 111 Gary St
- 19 Benson St
- 45 Ilyssa Way
- 25 Berry Ave W
- 185 Woodrow Rd
- 69 Token St
- 65 Benson St
- 60 Ilyssa Way
- 70 Ilyssa Way
- 171 Aspen Knolls Way
- 384 Aspen Knolls Way
- 100 Gold Ave
- 185 Aspen Knolls Way
- 46 Bianca Ct
- 270 Aspen Knolls Way
- 400 Aspen Knolls Way Unit B2
- 34 Jamie Ln