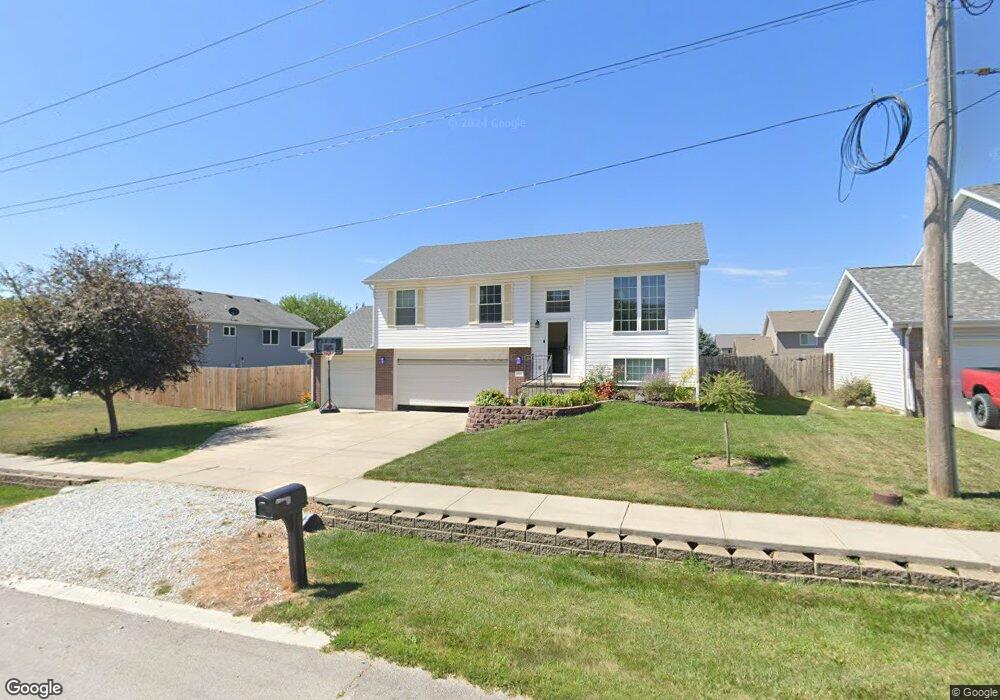
175 Jefferson St Bennet, NE 68317
Estimated Value: $273,000 - $317,000
3
Beds
4
Baths
1,113
Sq Ft
$268/Sq Ft
Est. Value
About This Home
This home is located at 175 Jefferson St, Bennet, NE 68317 and is currently estimated at $298,273, approximately $267 per square foot. 175 Jefferson St is a home located in Lancaster County with nearby schools including Elementary at Bennet and Junior/Senior High School at Palmyra.
Ownership History
Date
Name
Owned For
Owner Type
Purchase Details
Closed on
May 12, 2010
Sold by
Spier Gary and Spier Kellie
Bought by
Horst Michael L
Current Estimated Value
Home Financials for this Owner
Home Financials are based on the most recent Mortgage that was taken out on this home.
Original Mortgage
$143,073
Outstanding Balance
$96,521
Interest Rate
5.5%
Mortgage Type
FHA
Estimated Equity
$201,752
Purchase Details
Closed on
Oct 19, 2007
Sold by
Cherry Hill Homes Inc
Bought by
Spier Gary and Schwartz Kellie
Home Financials for this Owner
Home Financials are based on the most recent Mortgage that was taken out on this home.
Original Mortgage
$139,900
Interest Rate
6.32%
Mortgage Type
Unknown
Purchase Details
Closed on
May 16, 2007
Sold by
Bennet Ridge Llc
Bought by
Cherry Hill Homes Inc
Create a Home Valuation Report for This Property
The Home Valuation Report is an in-depth analysis detailing your home's value as well as a comparison with similar homes in the area
Purchase History
| Date | Buyer | Sale Price | Title Company |
|---|---|---|---|
| Horst Michael L | $145,000 | Multiple | |
| Spier Gary | $140,000 | Ntc | |
| Cherry Hill Homes Inc | $25,000 | Ntc |
Source: Public Records
Mortgage History
| Date | Status | Borrower | Loan Amount |
|---|---|---|---|
| Open | Horst Michael L | $143,073 | |
| Previous Owner | Spier Gary | $139,900 |
Source: Public Records
Tax History
| Year | Tax Paid | Tax Assessment Tax Assessment Total Assessment is a certain percentage of the fair market value that is determined by local assessors to be the total taxable value of land and additions on the property. | Land | Improvement |
|---|---|---|---|---|
| 2025 | $2,972 | $285,800 | $70,000 | $215,800 |
| 2024 | $2,972 | $230,800 | $62,000 | $168,800 |
| 2023 | $4,032 | $230,800 | $62,000 | $168,800 |
| 2022 | $3,828 | $202,500 | $48,000 | $154,500 |
| 2021 | $3,610 | $202,500 | $48,000 | $154,500 |
| 2020 | $3,386 | $183,000 | $48,000 | $135,000 |
| 2019 | $3,406 | $183,000 | $48,000 | $135,000 |
| 2018 | $2,987 | $154,300 | $35,000 | $119,300 |
| 2017 | $2,890 | $154,300 | $35,000 | $119,300 |
| 2016 | $2,919 | $142,800 | $30,000 | $112,800 |
| 2015 | $2,859 | $142,800 | $30,000 | $112,800 |
| 2014 | $2,887 | $141,400 | $30,000 | $111,400 |
| 2013 | -- | $141,400 | $30,000 | $111,400 |
Source: Public Records
Map
Nearby Homes
- 65 Vince Dr
- 195 Switchgrass Ln
- 185 Switchgrass Ln
- 1240 Hackberry St
- 400 Evergreen Rd
- 1240 Evergreen Rd
- 1140 Evergreen Rd
- 920 Evergreen Rd
- 1180 Evergreen Rd
- 1245 Evergreen Rd
- 405 Evergreen Rd
- 985 Evergreen Rd
- 1201 Evergreen Rd
- 1167 Evergreen Rd
- 1020 Evergreen Rd
- 1125 Evergreen Rd
- 945 Evergreen Rd
- 1005 Evergreen Rd
- 1100 Evergreen Rd
- 915 Evergreen Rd
Your Personal Tour Guide
Ask me questions while you tour the home.