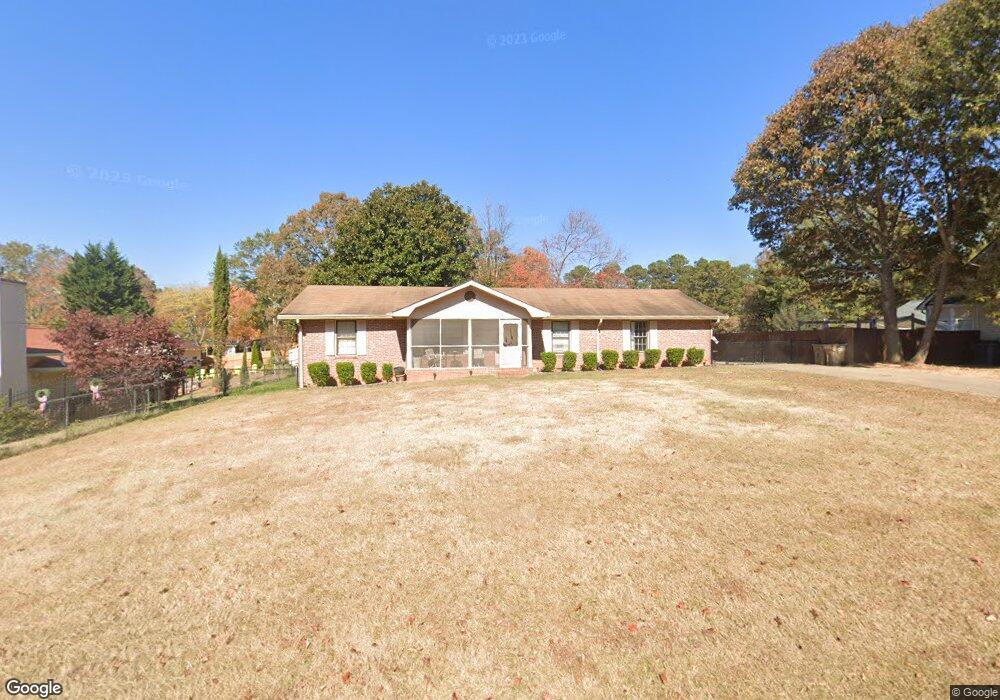
175 Johnson Dr Braselton, GA 30517
Estimated Value: $310,475 - $360,000
3
Beds
2
Baths
1,914
Sq Ft
$175/Sq Ft
Est. Value
About This Home
This home is located at 175 Johnson Dr, Braselton, GA 30517 and is currently estimated at $334,369, approximately $174 per square foot. 175 Johnson Dr is a home located in Jackson County with nearby schools including West Jackson Elementary School, West Jackson Middle School, and Jackson County High School.
Ownership History
Date
Name
Owned For
Owner Type
Purchase Details
Closed on
Jun 14, 2022
Sold by
Abney Steve
Bought by
Abney Steve and Johnson Britany Lynn
Current Estimated Value
Purchase Details
Closed on
May 23, 2018
Sold by
Abney Barbara
Bought by
Abney Steve Trustee and Barbara Abney Rev Liv Trust
Purchase Details
Closed on
Jan 13, 2010
Sold by
Secretary Of Veterans Affairs
Bought by
Abney Barbara A and Abney Steve W
Home Financials for this Owner
Home Financials are based on the most recent Mortgage that was taken out on this home.
Original Mortgage
$60,720
Interest Rate
4.94%
Mortgage Type
New Conventional
Purchase Details
Closed on
Sep 1, 2009
Sold by
Midfirst Bank
Bought by
Secretary Of Veterans Affairs
Purchase Details
Closed on
Dec 4, 2000
Sold by
Bennett Marion B
Bought by
Wehry Willard L
Purchase Details
Closed on
Feb 12, 1996
Bought by
Bennett Marion B
Create a Home Valuation Report for This Property
The Home Valuation Report is an in-depth analysis detailing your home's value as well as a comparison with similar homes in the area
Home Values in the Area
Average Home Value in this Area
Purchase History
| Date | Buyer | Sale Price | Title Company |
|---|---|---|---|
| Abney Steve | -- | -- | |
| Abney Steve Trustee | -- | -- | |
| Abney Barbara A | $75,900 | -- | |
| Secretary Of Veterans Affairs | $96,062 | -- | |
| Midfirst Bank | $96,062 | -- | |
| Wehry Willard L | $102,500 | -- | |
| Bennett Marion B | -- | -- |
Source: Public Records
Mortgage History
| Date | Status | Borrower | Loan Amount |
|---|---|---|---|
| Previous Owner | Abney Barbara A | $60,720 |
Source: Public Records
Tax History
| Year | Tax Paid | Tax Assessment Tax Assessment Total Assessment is a certain percentage of the fair market value that is determined by local assessors to be the total taxable value of land and additions on the property. | Land | Improvement |
|---|---|---|---|---|
| 2025 | $2,082 | $78,040 | $17,600 | $60,440 |
| 2024 | $2,082 | $78,040 | $17,600 | $60,440 |
| 2023 | $2,104 | $70,840 | $17,600 | $53,240 |
| 2022 | $2,043 | $66,520 | $17,600 | $48,920 |
| 2021 | $1,821 | $58,920 | $10,000 | $48,920 |
| 2020 | $1,650 | $49,000 | $10,000 | $39,000 |
| 2019 | $1,673 | $49,000 | $10,000 | $39,000 |
| 2018 | $1,697 | $49,040 | $10,000 | $39,040 |
| 2017 | $1,576 | $45,186 | $10,000 | $35,186 |
| 2016 | $1,433 | $40,918 | $10,000 | $30,918 |
| 2015 | $1,440 | $40,918 | $10,000 | $30,918 |
| 2014 | $1,392 | $40,381 | $10,000 | $30,381 |
| 2013 | -- | $40,381 | $10,000 | $30,381 |
Source: Public Records
Map
Nearby Homes
- 83 Kings Dr
- 98 King's Dr
- 6529 Highway 53
- 21 Duck Rd
- 6647 Highway 53
- 6647 Hwy 53
- 53 Ednaville Rd
- 156 Reisling Dr
- 00 Zion Church & Hwy 124 Rd
- 0 Lewis Braselton (Aka Hwy 124) Blvd Unit CL349426
- 7174 Highway 53
- 751 Walnut Woods Dr
- 5455 Highway 53
- 1030 Glenwyck Dr
- 1036 Glenwyck Dr
- 811 Walnut Woods Dr
- 1145 Glenwyck Dr
- 329 Traminer Way
- 136 Port Way
- 132 Port Way
Your Personal Tour Guide
Ask me questions while you tour the home.