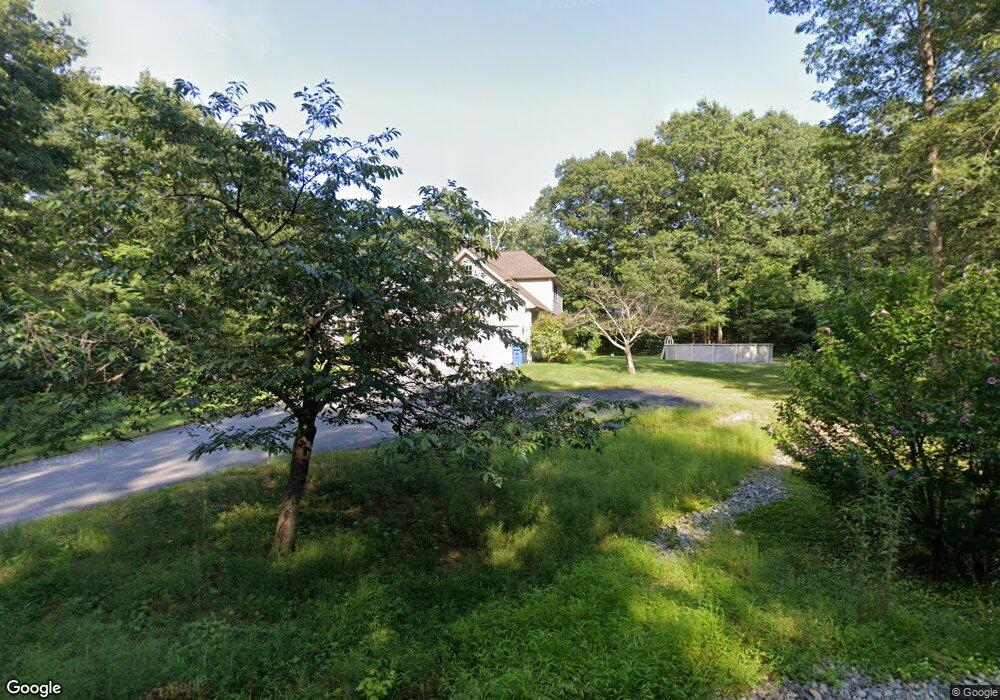
175 Lafantasie Rd Danielson, CT 06239
Estimated Value: $515,400 - $585,000
3
Beds
3
Baths
1,692
Sq Ft
$325/Sq Ft
Est. Value
About This Home
This home is located at 175 Lafantasie Rd, Danielson, CT 06239 and is currently estimated at $550,350, approximately $325 per square foot. 175 Lafantasie Rd is a home located in Windham County with nearby schools including Killingly Central School, Killingly Memorial School, and Killingly Intermediate School.
Ownership History
Date
Name
Owned For
Owner Type
Purchase Details
Closed on
Aug 30, 2004
Sold by
Tjk Const Co Llc
Bought by
Mccauley Bruce and Mccauley Lisa
Current Estimated Value
Home Financials for this Owner
Home Financials are based on the most recent Mortgage that was taken out on this home.
Original Mortgage
$185,000
Interest Rate
6.02%
Create a Home Valuation Report for This Property
The Home Valuation Report is an in-depth analysis detailing your home's value as well as a comparison with similar homes in the area
Home Values in the Area
Average Home Value in this Area
Purchase History
| Date | Buyer | Sale Price | Title Company |
|---|---|---|---|
| Mccauley Bruce | $335,000 | -- | |
| Mccauley Bruce | $335,000 | -- |
Source: Public Records
Mortgage History
| Date | Status | Borrower | Loan Amount |
|---|---|---|---|
| Open | Mccauley Bruce | $30,300 | |
| Open | Mccauley Bruce | $259,000 | |
| Closed | Mccauley Bruce | $185,000 |
Source: Public Records
Tax History
| Year | Tax Paid | Tax Assessment Tax Assessment Total Assessment is a certain percentage of the fair market value that is determined by local assessors to be the total taxable value of land and additions on the property. | Land | Improvement |
|---|---|---|---|---|
| 2025 | $8,050 | $346,390 | $37,720 | $308,670 |
| 2024 | $7,659 | $346,390 | $37,720 | $308,670 |
| 2023 | $5,999 | $206,360 | $32,690 | $173,670 |
| 2022 | $5,640 | $206,360 | $32,690 | $173,670 |
| 2021 | $5,621 | $206,360 | $32,690 | $173,670 |
| 2020 | $5,518 | $206,360 | $32,690 | $173,670 |
| 2019 | $5,605 | $206,360 | $32,690 | $173,670 |
| 2017 | $5,195 | $180,950 | $25,690 | $155,260 |
| 2016 | $5,195 | $180,950 | $25,690 | $155,260 |
| 2015 | $5,195 | $180,950 | $25,690 | $155,260 |
| 2014 | $5,050 | $180,950 | $25,690 | $155,260 |
Source: Public Records
Map
Nearby Homes
- 0 Cook Hill Rd Unit 24135933
- 380 Mashentuck Rd
- 175 Mashentuck Rd
- 85 Mashentuck Rd
- 64 Westcott Rd
- 395 Bailey Hill Rd
- 23 Bailey Hill Village
- 724 Cook Hill Rd
- 61 Deerwood Dr
- 679 Bailey Hill Rd
- 73 Hawkins St
- 56 Deerwood Dr
- 842 Hartford Pike
- 102 Cottage St
- 24 Center St
- 10 Center St
- 18 Broad St
- 74 Athol St
- 48 Athol St Unit 48
- 14 Valley View Dr
- 179 Lafantasie Rd
- 171 Lafantasie Rd
- 547 Justen Way
- 163 Lafantasie Rd
- 141 Lafantasie Rd
- 155 Lafantasie Rd
- 385 Cook Hill Rd
- 167 Lafantasie Rd
- 533 Justen Way
- 147 Lafantasie Rd
- 26 Sounding Ave
- 525 Justen Way
- 4 Orleans Ave
- 371 Cook Hill Rd
- 125 Lafantasie Rd
- 75 Geer Rd
- 2 Orleans Ave
- 6 Orleans Ave
- 21 Geer Rd
- 445 Cook Hill Rd
Your Personal Tour Guide
Ask me questions while you tour the home.