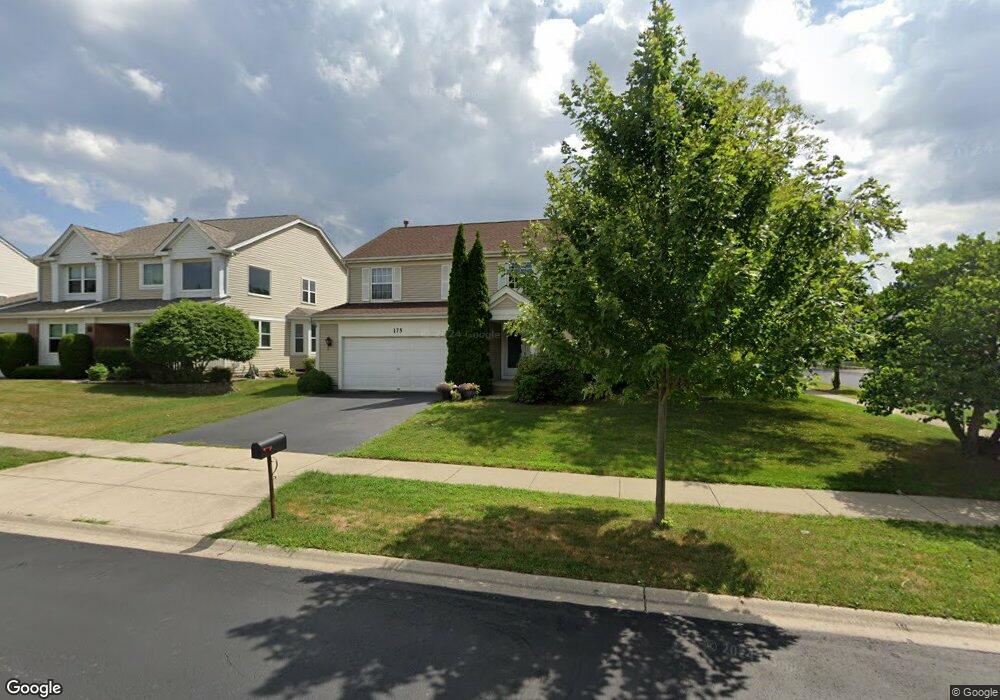
175 Lemans Dr Wheeling, IL 60090
Estimated Value: $507,738 - $625,000
3
Beds
2
Baths
2,193
Sq Ft
$260/Sq Ft
Est. Value
About This Home
This home is located at 175 Lemans Dr, Wheeling, IL 60090 and is currently estimated at $570,185, approximately $260 per square foot. 175 Lemans Dr is a home located in Cook County with nearby schools including Frost Elementary School, Oliver W Holmes Middle School, and Wheeling High School.
Ownership History
Date
Name
Owned For
Owner Type
Purchase Details
Closed on
Aug 23, 2001
Sold by
Shukla Manish and Shukla Roma
Bought by
Shulman Michael and Abeleva Shulman Alla
Current Estimated Value
Home Financials for this Owner
Home Financials are based on the most recent Mortgage that was taken out on this home.
Original Mortgage
$180,000
Outstanding Balance
$68,455
Interest Rate
7.28%
Estimated Equity
$501,730
Purchase Details
Closed on
Feb 14, 2000
Sold by
Shukla Manish and Shukla Roma
Bought by
Shukla Manish and Shukla Roma
Purchase Details
Closed on
Jun 11, 1997
Sold by
Avalon Sienna Llc
Bought by
Shukla Manish and Shukla Roma
Home Financials for this Owner
Home Financials are based on the most recent Mortgage that was taken out on this home.
Original Mortgage
$183,000
Interest Rate
6.37%
Create a Home Valuation Report for This Property
The Home Valuation Report is an in-depth analysis detailing your home's value as well as a comparison with similar homes in the area
Home Values in the Area
Average Home Value in this Area
Purchase History
| Date | Buyer | Sale Price | Title Company |
|---|---|---|---|
| Shulman Michael | $310,000 | -- | |
| Shukla Manish | -- | -- | |
| Shukla Manish | $229,000 | -- |
Source: Public Records
Mortgage History
| Date | Status | Borrower | Loan Amount |
|---|---|---|---|
| Open | Shulman Michael | $180,000 | |
| Previous Owner | Shukla Manish | $183,000 |
Source: Public Records
Tax History
| Year | Tax Paid | Tax Assessment Tax Assessment Total Assessment is a certain percentage of the fair market value that is determined by local assessors to be the total taxable value of land and additions on the property. | Land | Improvement |
|---|---|---|---|---|
| 2025 | $10,469 | $49,000 | $12,632 | $36,368 |
| 2024 | $10,469 | $37,001 | $14,576 | $22,425 |
| 2023 | $10,802 | $37,001 | $14,576 | $22,425 |
| 2022 | $10,802 | $37,001 | $14,576 | $22,425 |
| 2021 | $10,785 | $32,233 | $7,287 | $24,946 |
| 2020 | $10,576 | $32,233 | $7,287 | $24,946 |
| 2019 | $10,779 | $36,096 | $7,287 | $28,809 |
| 2018 | $11,720 | $35,348 | $6,316 | $29,032 |
| 2017 | $11,493 | $35,348 | $6,316 | $29,032 |
| 2016 | $11,024 | $35,348 | $6,316 | $29,032 |
| 2015 | $10,716 | $32,501 | $5,587 | $26,914 |
| 2014 | $10,460 | $32,501 | $5,587 | $26,914 |
| 2013 | $9,662 | $32,501 | $5,587 | $26,914 |
Source: Public Records
Map
Nearby Homes
- 1975 Merlot Ct
- 55 Willow Rd
- 15 E Willow Rd
- 42 Cherbourg Ct Unit 492714
- 103 Coldren Dr
- 1550 Sandpebble Dr Unit 209
- 1525 Sander Ct Unit 113
- 1525 Sander Ct Unit 108
- 1525 Sander Ct Unit 103
- 1450 Sandpebble Dr Unit 333
- 304 E Camp Mcdonald Rd
- 206 E Camp Mcdonald Rd
- 109 Rob Roy Ln Unit C
- 584 Edinburgh Ln Unit A
- 7 Alton Rd
- 664 Pinecrest Dr Unit 302
- 16 Robert Ave
- 674 Pinecrest Dr Unit 203
- 509 Aberdeen Ln Unit C
- 501 Aberdeen Ln Unit C
Your Personal Tour Guide
Ask me questions while you tour the home.