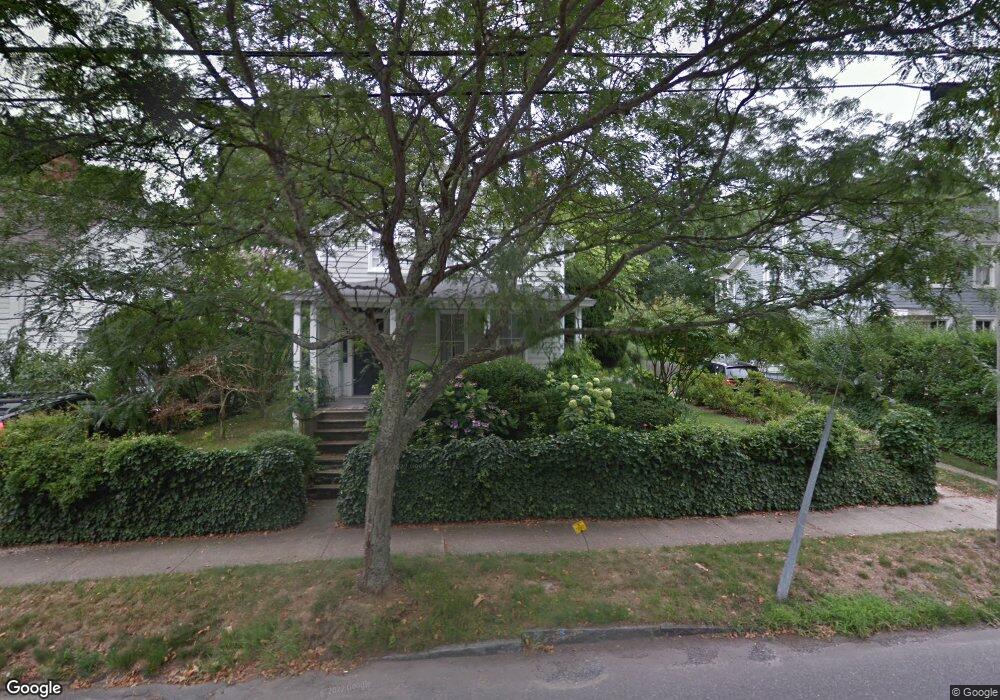
175 Madison St Sag Harbor, NY 11963
Estimated Value: $2,472,000 - $3,688,334
3
Beds
2
Baths
1,552
Sq Ft
$2,065/Sq Ft
Est. Value
About This Home
This home is located at 175 Madison St, Sag Harbor, NY 11963 and is currently estimated at $3,204,445, approximately $2,064 per square foot. 175 Madison St is a home located in Suffolk County with nearby schools including Sag Harbor Elementary School, Pierson Middle/High School, and Ross School.
Ownership History
Date
Name
Owned For
Owner Type
Purchase Details
Closed on
Sep 10, 2013
Sold by
Harris Adrienne and Zeavin Lynne E
Bought by
Harris Adrienne E
Current Estimated Value
Home Financials for this Owner
Home Financials are based on the most recent Mortgage that was taken out on this home.
Original Mortgage
$11,525
Outstanding Balance
$8,607
Interest Rate
4.42%
Mortgage Type
New Conventional
Estimated Equity
$3,195,838
Create a Home Valuation Report for This Property
The Home Valuation Report is an in-depth analysis detailing your home's value as well as a comparison with similar homes in the area
Home Values in the Area
Average Home Value in this Area
Purchase History
| Date | Buyer | Sale Price | Title Company |
|---|---|---|---|
| Harris Adrienne E | $550,000 | Globalserve Title | |
| Harris Adrienne | -- | Globalserve Title |
Source: Public Records
Mortgage History
| Date | Status | Borrower | Loan Amount |
|---|---|---|---|
| Open | Harris Adrienne | $11,525 | |
| Closed | Harris Adrienne | $11,525 |
Source: Public Records
Tax History Compared to Growth
Tax History
| Year | Tax Paid | Tax Assessment Tax Assessment Total Assessment is a certain percentage of the fair market value that is determined by local assessors to be the total taxable value of land and additions on the property. | Land | Improvement |
|---|---|---|---|---|
| 2024 | $5,645 | $2,032,400 | $1,047,200 | $985,200 |
| 2023 | $16,777 | $2,032,400 | $1,047,200 | $985,200 |
| 2022 | $5,519 | $2,032,400 | $1,047,200 | $985,200 |
| 2021 | $5,835 | $2,135,700 | $1,047,200 | $1,088,500 |
| 2020 | $11,445 | $2,135,700 | $1,047,200 | $1,088,500 |
| 2019 | $17,079 | $0 | $0 | $0 |
| 2018 | -- | $1,874,000 | $977,400 | $896,600 |
| 2017 | $10,365 | $1,804,100 | $907,500 | $896,600 |
| 2016 | $6,733 | $1,126,900 | $907,500 | $219,400 |
| 2015 | -- | $1,126,900 | $907,500 | $219,400 |
| 2014 | -- | $1,126,900 | $907,500 | $219,400 |
Source: Public Records
Map
Nearby Homes