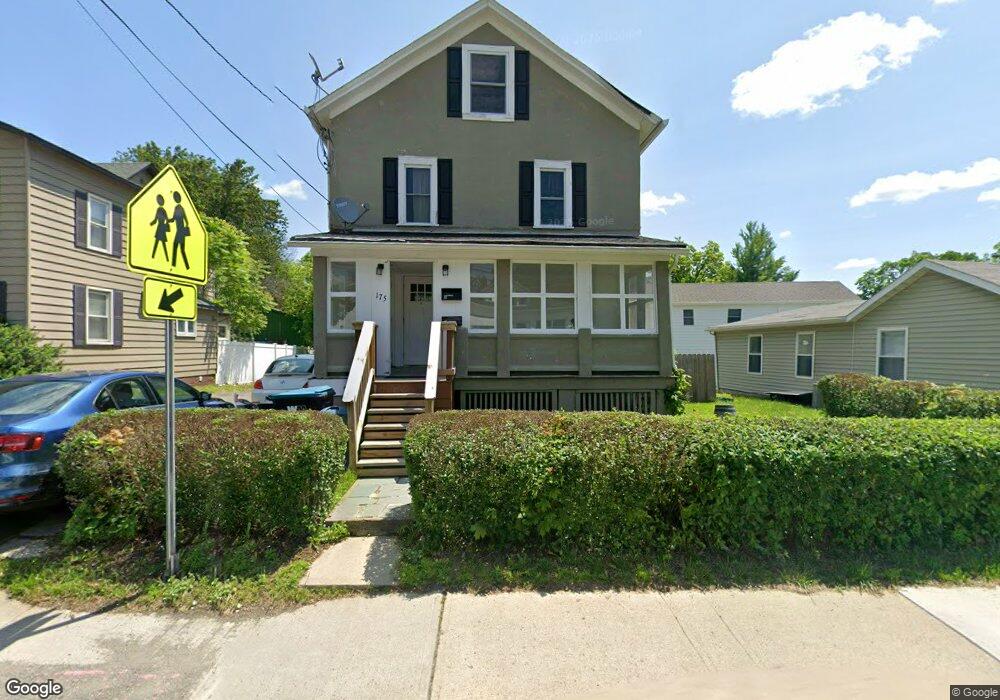
175 Main St Unit B Newton, NJ 07860
Estimated Value: $347,104 - $449,000
3
Beds
1
Bath
1,689
Sq Ft
$235/Sq Ft
Est. Value
About This Home
This home is located at 175 Main St Unit B, Newton, NJ 07860 and is currently estimated at $397,276, approximately $235 per square foot. 175 Main St Unit B is a home located in Sussex County with nearby schools including Merriam Avenue School, Halsted Street Middle School, and Newton High School.
Ownership History
Date
Name
Owned For
Owner Type
Purchase Details
Closed on
May 31, 2022
Sold by
Rochman Jared
Bought by
175 Main Street Newton Llc
Current Estimated Value
Purchase Details
Closed on
Jun 19, 2021
Sold by
Anderson Enterprise Llc
Bought by
Rochman Jared and Rochman Renee
Home Financials for this Owner
Home Financials are based on the most recent Mortgage that was taken out on this home.
Original Mortgage
$266,250
Interest Rate
2.9%
Mortgage Type
New Conventional
Purchase Details
Closed on
Jan 2, 2019
Sold by
Carisbrook Asset Holding Trust
Bought by
Anderson Enterprises Llc
Purchase Details
Closed on
Mar 5, 2018
Sold by
Anthony Michael Hu
Bought by
Caris Brook Asset Holdings Trusts
Purchase Details
Closed on
Sep 10, 2002
Sold by
Drew Randall G and Drew Tracey
Bought by
Hu Michael Anthony
Home Financials for this Owner
Home Financials are based on the most recent Mortgage that was taken out on this home.
Original Mortgage
$130,400
Interest Rate
6.27%
Mortgage Type
FHA
Purchase Details
Closed on
Mar 30, 2001
Sold by
Drew Randall G and Ferioli Elnora
Bought by
Drew Randall G
Create a Home Valuation Report for This Property
The Home Valuation Report is an in-depth analysis detailing your home's value as well as a comparison with similar homes in the area
Home Values in the Area
Average Home Value in this Area
Purchase History
| Date | Buyer | Sale Price | Title Company |
|---|---|---|---|
| 175 Main Street Newton Llc | $261,754 | Simplicity Title | |
| 175 Main Street Newton Llc | $261,754 | Simplicity Title | |
| Rochman Jared | $355,000 | Simplicity Title Llc | |
| Anderson Enterprises Llc | $86,000 | Chancellor Title Agency Inc | |
| Caris Brook Asset Holdings Trusts | -- | None Available | |
| Hu Michael Anthony | $138,500 | Stewart Title Insurance Co | |
| Drew Randall G | -- | -- |
Source: Public Records
Mortgage History
| Date | Status | Borrower | Loan Amount |
|---|---|---|---|
| Previous Owner | Rochman Jared | $266,250 | |
| Previous Owner | Hu Michael Anthony | $130,400 |
Source: Public Records
Tax History
| Year | Tax Paid | Tax Assessment Tax Assessment Total Assessment is a certain percentage of the fair market value that is determined by local assessors to be the total taxable value of land and additions on the property. | Land | Improvement |
|---|---|---|---|---|
| 2025 | $9,795 | $376,400 | $69,400 | $307,000 |
| 2024 | $9,127 | $359,200 | $59,300 | $299,900 |
Source: Public Records
Map
Nearby Homes
- 9 Lawnwood Ave
- 85 Madison St
- 32 Mason Ave
- 103 Woodside Ave
- 14 Ridgeview Rd
- 78 Carriage Ln
- 76 Carriage Ln Unit 76
- 39 Halsted St
- 39 Halsted St Unit 2
- 36 Pine St
- 40 Carriage Ln Unit 40
- 49 Sussex St
- 22-24 Sussex St
- 46 Orchard St Unit 2
- 14 Trenton Place
- 6 Madison St
- 5 Jefferson St
- 4 Gregg Ct
- 88 Trinity St
- 21 Gregg Ct
Your Personal Tour Guide
Ask me questions while you tour the home.